Dispatcher queue usage – H3C Technologies H3C Intelligent Management Center User Manual
Page 644
630
Figure 534 Buffer area layout
Buffer area fields:
•
Buffer Name—Name of the buffer used by the SAP application.
•
Directory Usage—Percentage of the used directory in the buffer when APM last polled SAP.
•
Space Usage—Percentage of the used storage space in the buffer when APM last polled SAP.
•
Swap Frequency—Number of swaps that occur in the buffer per minute due to full buffer. The data
was obtained when APM last polled SAP.
•
Hit Ratio—Percentage of database queries that were found in the buffer instead of being sent to the
database. The data was obtained when APM last polled SAP.
•
History Record—Click the History Record icon
to view the history trend graph of the index. Point
to a spot on the curve to view data at the specific time point. Authorized users can view statistics
over the last 1 hour, last 6 hours, today, yesterday, this week, this month, and this year by clicking
the corresponding icons on the graph.
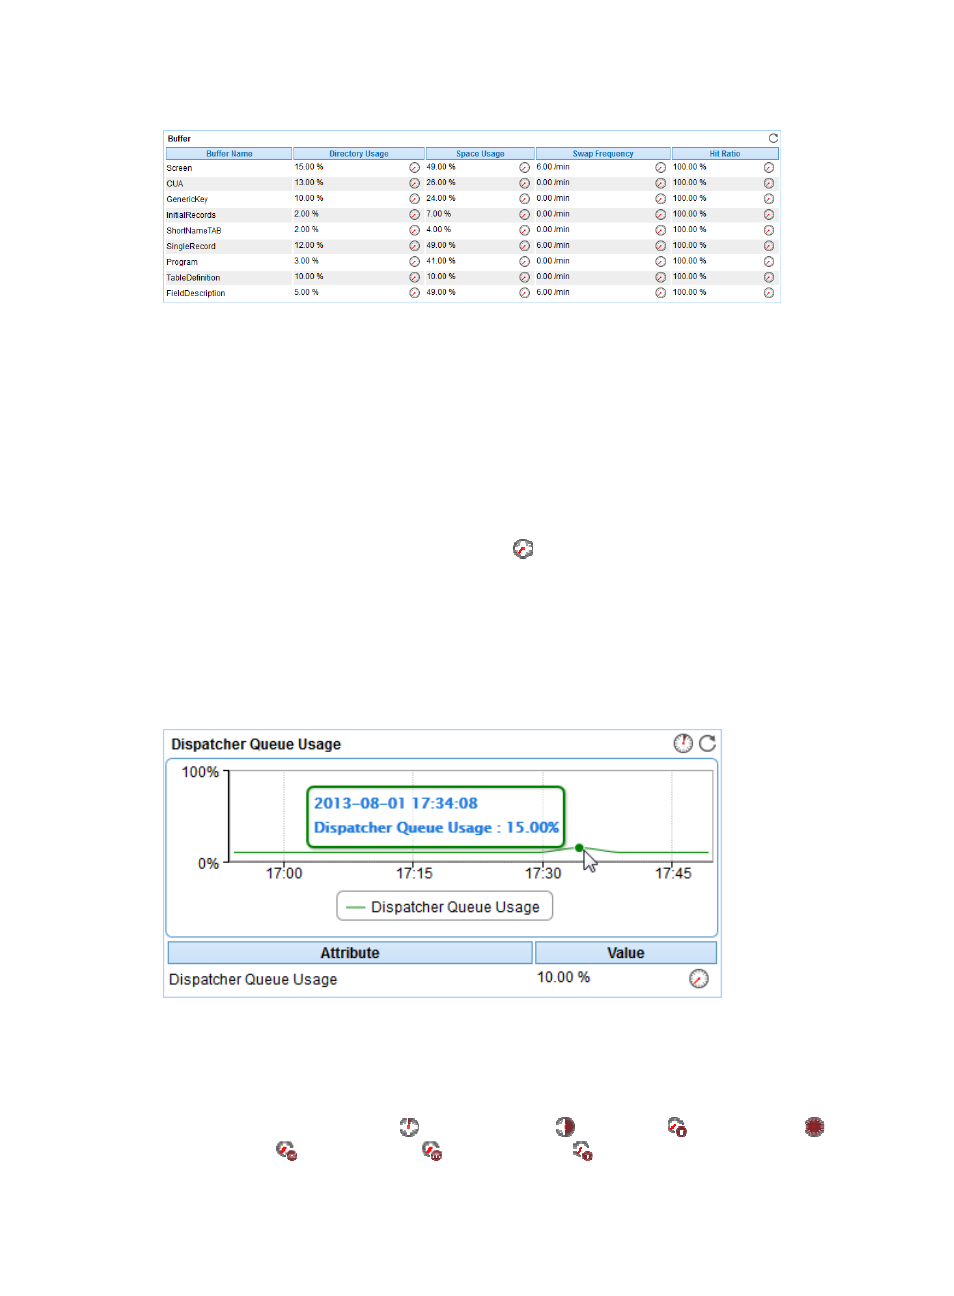
Dispatcher Queue Usage
The Dispatcher Queue Usage area is located on the Spool tab and its layout is shown in
.
Figure 535 Dispatcher Queue Usage area layout
Dispatcher Queue Usage area fields:
•
Trend graph—Shows the changes of the spool dispatcher queue usage for the SAP application in
a line chart. Point to a spot on the curve to view the spool dispatcher queue usage at the specific
time point. View the changes of the spool dispatcher queue usage over a specific time period by
clicking the Last 1 Hour icon
, Last 6 Hours icon
, Today icon
, Yesterday icon
, This
Week icon
, This Month icon
, or This Year icon
. The graph shows the last hour data by
default.