Application traffic, Network interface – H3C Technologies H3C Intelligent Management Center User Manual
Page 126
112
•
Process Name—Name of the zombie process in the most recent polling interval. Zombie processes
in the AIX do not have process names.
•
ID—ID of the zombie process in the most recent polling interval.
•
Parent ID—ID of the parent process for the zombie process in the most recent polling interval.
•
CPU Usage—CPU usage of the zombie process in the most recent polling interval.
{
Set Threshold—Click the Set Threshold icon
to set alarm thresholds for the CPU usage of the
zombie process. The data is highlighted in orange when the CPU usage of the zombie process
reaches the level-1 threshold, and is highlighted in red when the CPU usage of the zombie
process reaches the level-2 threshold. You can set global thresholds or custom thresholds. For
information about setting the thresholds, see "
{
History Record—Click the History Record icon
to view the history graph of the CPU usage
of the zombie process in last 1 hour, last 6 hours, today, yesterday, this week, this month, or this
year.
•
Memory Usage—Memory usage of the zombie process in the most recent polling interval.
{
History Record—Click the History Record icon
to view the history graph of the memory
usage of the zombie process in last 1 hour, last 6 hours, today, yesterday, this week, this month,
or this year.
•
CPU Time—Duration that the zombie process occupies the CPU in the most recent polling interval.
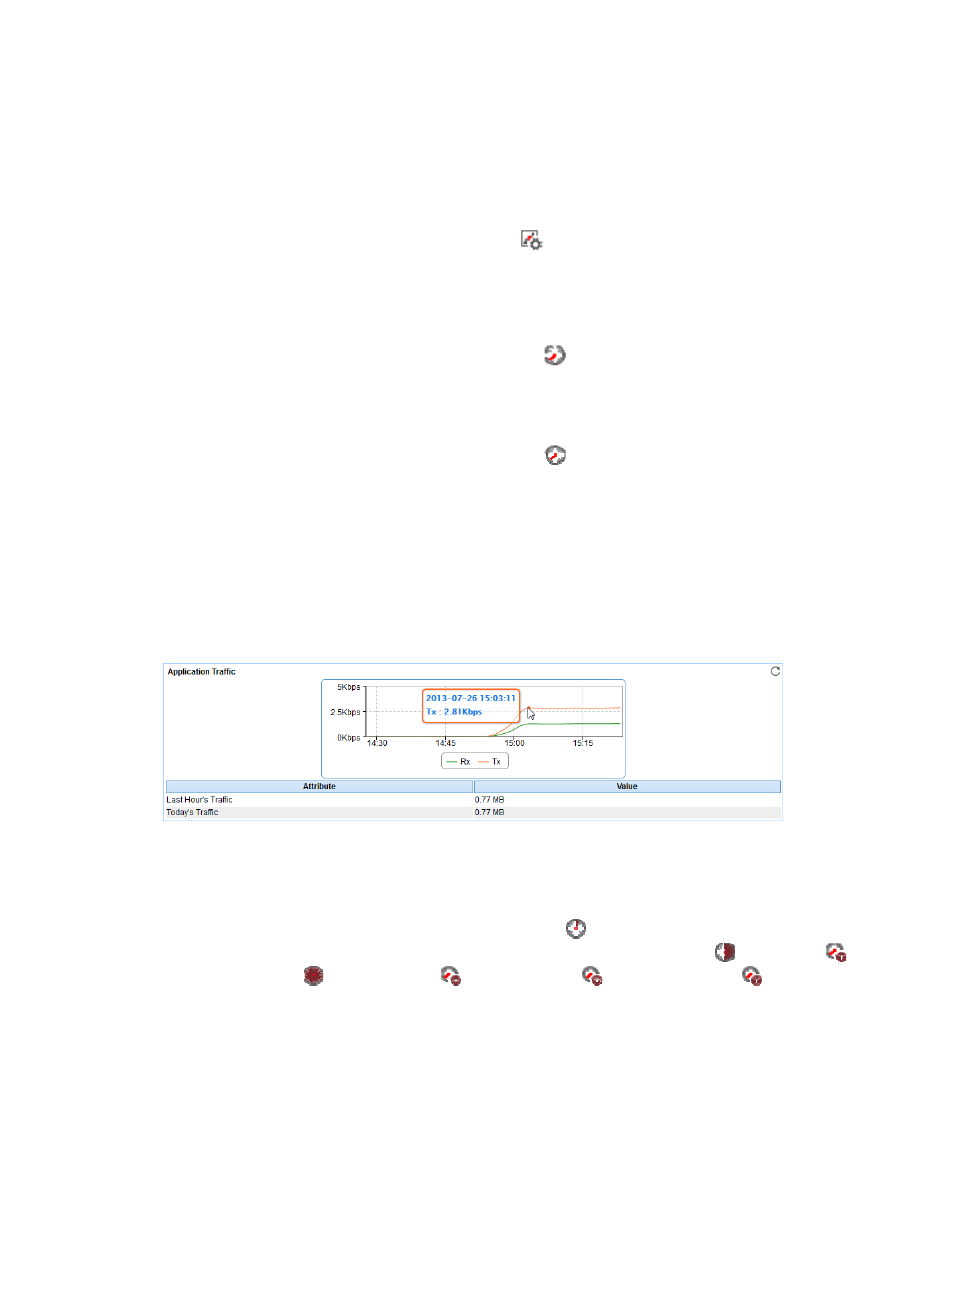
Application Traffic
APM collects AIX traffic based on the IP address of the host where the application resides. The
Application Traffic area layout is shown in
.
Figure 64 Application Traffic area layout
Application Traffic area fields:
•
Application Traffic trend graph—Shows changes of inbound and outbound AIX traffic over the last
1 hour. The green curve shows the inbound traffic and the orange curve shows the outbound traffic.
To change the report period, click the Last 1 Hour icon
on the upper right of the graph, and then
select an icon from the list. Available options include the Last 6 Hours icon
, Today icon
,
Yesterday icon
, This Week icon ,
This Month icon
, and This Year icon
. Point to a spot
on the curve to view the application traffic at the specific time point. Click Rx or Tx to display or hide
the corresponding monitor index in the graph.
•
Attribute/Value—Monitor index name and data that was obtained when APM last polled AIX.
{
Last Hour's Traffic—Total traffic sent and received by AIX over the last 1 hour.
{
Today's Traffic—Total traffic sent and received by AIX since 00:00 today.
Network Interface
The Network Interface area layout is shown in
.