Viewing a dependency topology, Method 1, Method 2 – H3C Technologies H3C Intelligent Management Center User Manual
Page 57
43
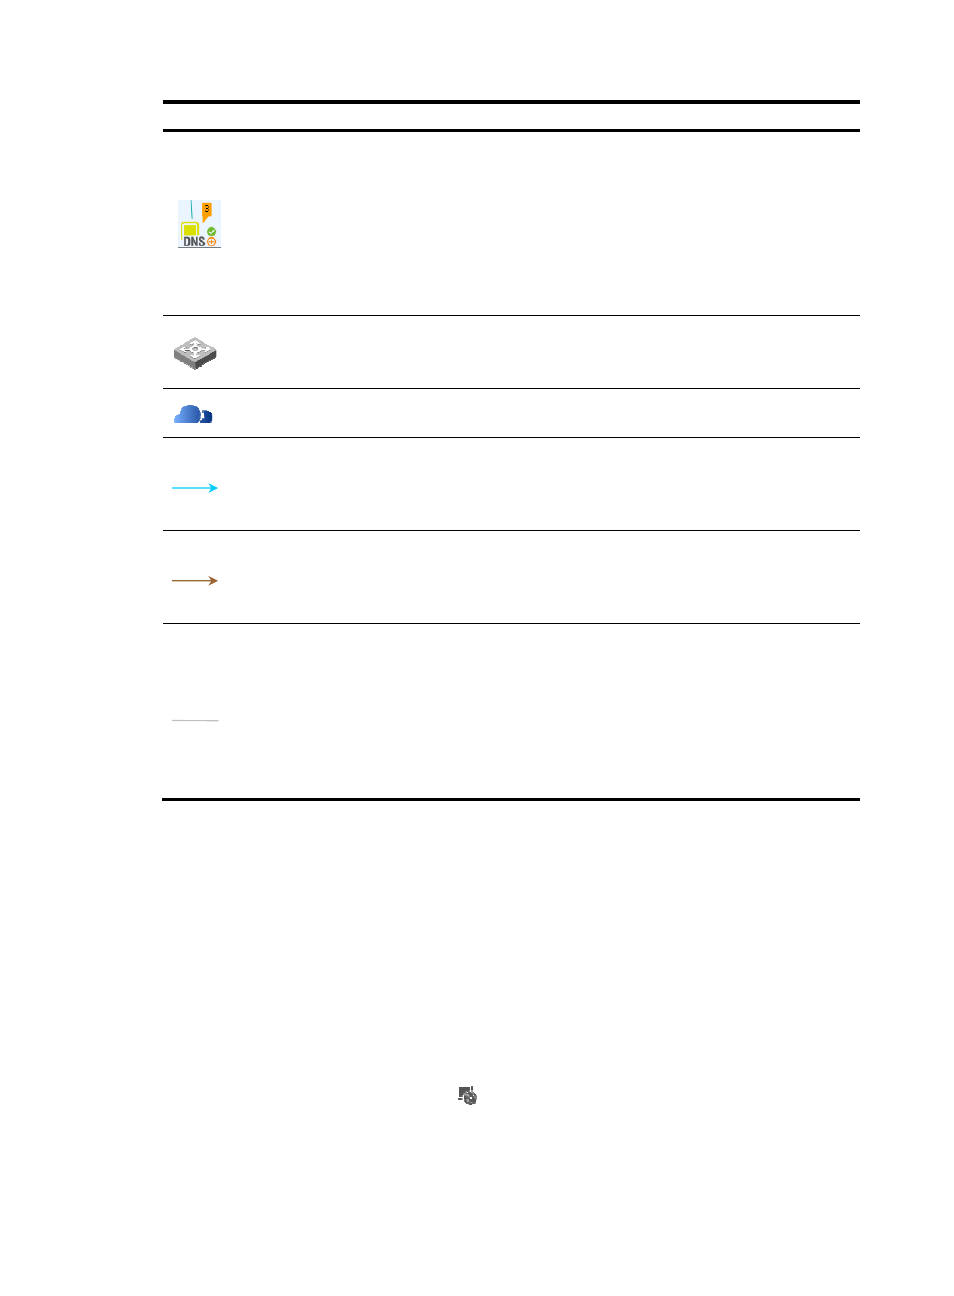
Icon Description
This icon contains the following information:
•
Alarm—Number and highest severity of unrecovered alarms for an application. This
icon does not appear if no unrecovered alarm exists for the application.
•
Availability—Availability of an application for the last polling query. The icon varies
with the availability. For more information, see "
•
Health status—Health status of an application for the last polling query. The icon
varies with the health status. For more information, see "
Represents a device that provides network access for applications.
To display such devices on the topology, make sure you have added them to the IMC
platform as access devices.
Represents the physical network to which an access device is connected.
Represents dependencies between two applications that use the same IP address.
A dashed line represents indirect dependencies between the applications. Indirect
dependencies are generated when the current operator has no management privileges to
one or more intermediate applications.
Represents dependencies between two applications that use different IP addresses.
A dashed line represents indirect dependencies between the applications. Indirect
dependencies are generated when the current operator has no management privileges to
one or more intermediate applications.
Represents the connection between a host and an access device or between an access
device and the physical network.
For a host-to-access device connection, the port that connects the host to the access device
is also displayed.
A dashed line represents an indirect connection between a host and the physical
network. An indirect connection is displayed when the access device is not added to the
IMC platform. For information about adding devices to IMC, see H3C IMC Base Platform
Administrator Guide.
Viewing a dependency topology
A dependency topology focuses on a single application and displays its dependencies with other
applications, directly or indirectly.
You can view a dependency topology by using multiple methods.
Method 1
1.
Click the Resource tab.
2.
Select Application Manager > Application Monitor from the navigation tree.
The application monitor list page displays all application monitors.
3.
Click the Dependency Topology icon
for the application for which you want to view the
dependency topology.
Method 2
1.
Click the Resource tab.