Job details, Database details – H3C Technologies H3C Intelligent Management Center User Manual
Page 256
242
Application Traffic area fields:
•
Application Traffic trend graph—Shows changes of inbound and outbound traffic over the last 1
hour. The green curve shows the inbound traffic and the orange curve shows the outbound traffic.
To change the report period, click the Last 1 Hour icon
on the upper right of the graph, and then
select an icon from the list. Available options include Last 6 Hours
, Today
, Yesterday
, This
Week
, This Month
, and This Year
. Point to a spot on the curve to view the application
traffic at the specific time point. Click Rx or Tx to display or hide the corresponding monitor index
in the graph.
•
Attribute/Value—Monitor index name and data that was obtained when APM last polled SQL
Server.
{
Last Hour's Traffic—Total traffic sent and received by SQL Server over the last 1 hour.
{
Today's Traffic—Total traffic sent and received by SQL Server since 00:00 today.
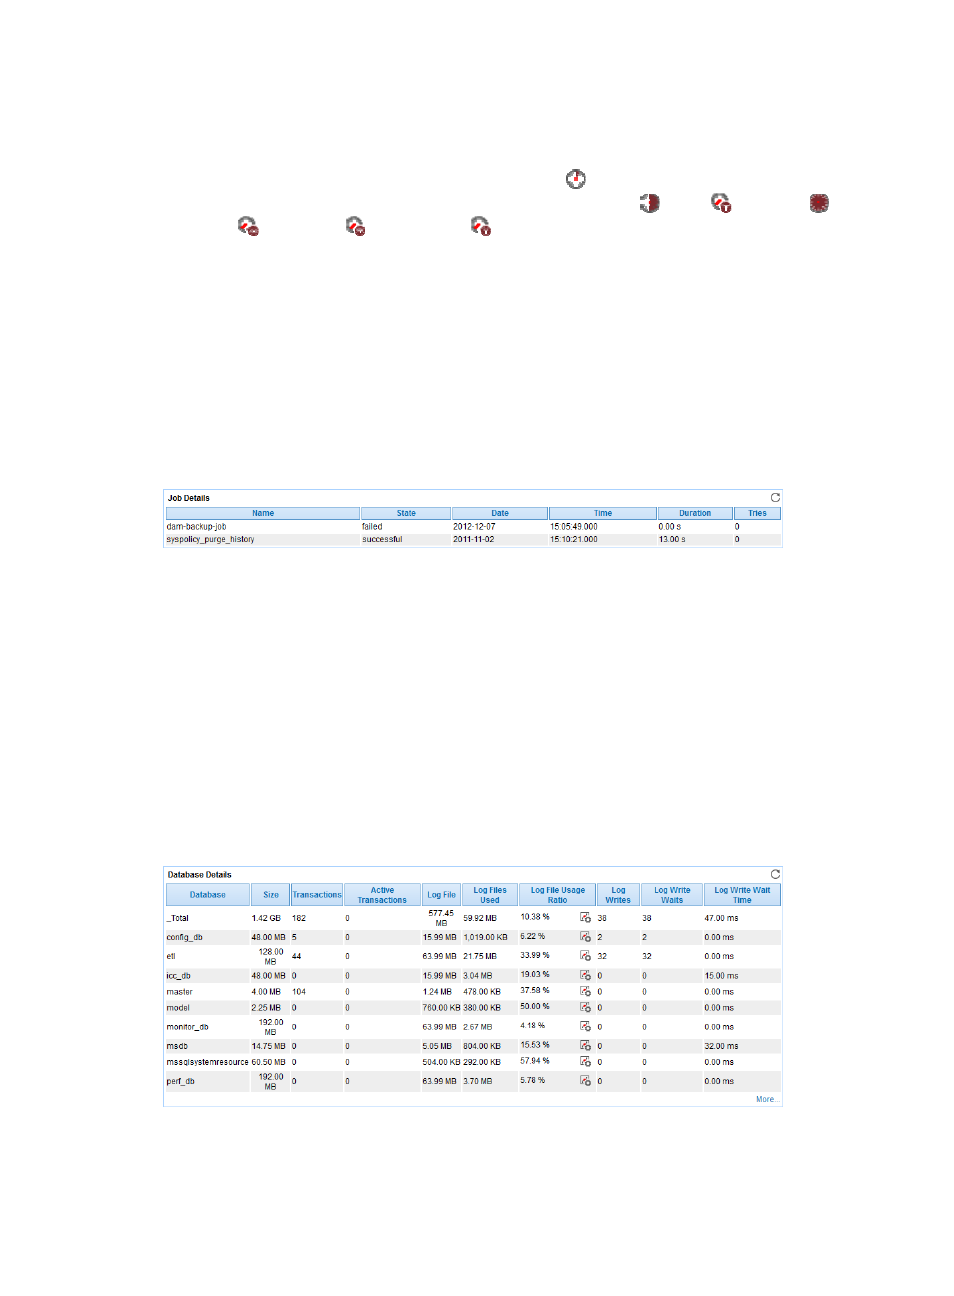
Job Details
The Job Details area layout is shown in
.
Figure 193 Job Details area layout
Job Details area fields:
•
Name—Name of the job that had or had not run when APM last polled SQL Server.
•
State—Job status. The en dash (-) indicates that the job has never run.
•
Date—Date when the job started running.
•
Time—Time when the job started running.
•
Duration—Running duration of the job.
•
Tries—Times that scheduled jobs tried to run.
Database Details
The Database Details area layout is shown in
.
Figure 194 Database Details area layout
Database Details area fields: