Performance, Memory usage – H3C Technologies H3C Intelligent Management Center User Manual
Page 345
331
•
Available Time—Total available time duration of the Tomcat server since 00:00 today.
•
Unavailable Time—Total unavailable time duration of the Tomcat server since 00:00 today.
•
Inaccessible Time—Total inaccessible time duration of the Tomcat server since 00:00 today.
•
Unmanaged Time—Total unmanaged time duration of the Tomcat server since 00:00 today.
Availability time statistics of a new application monitor are collected since 00:00 on the day when the
application monitor was added. An availability time field does not appear if its value is 0.
Performance
The Performance area layout is shown in
.
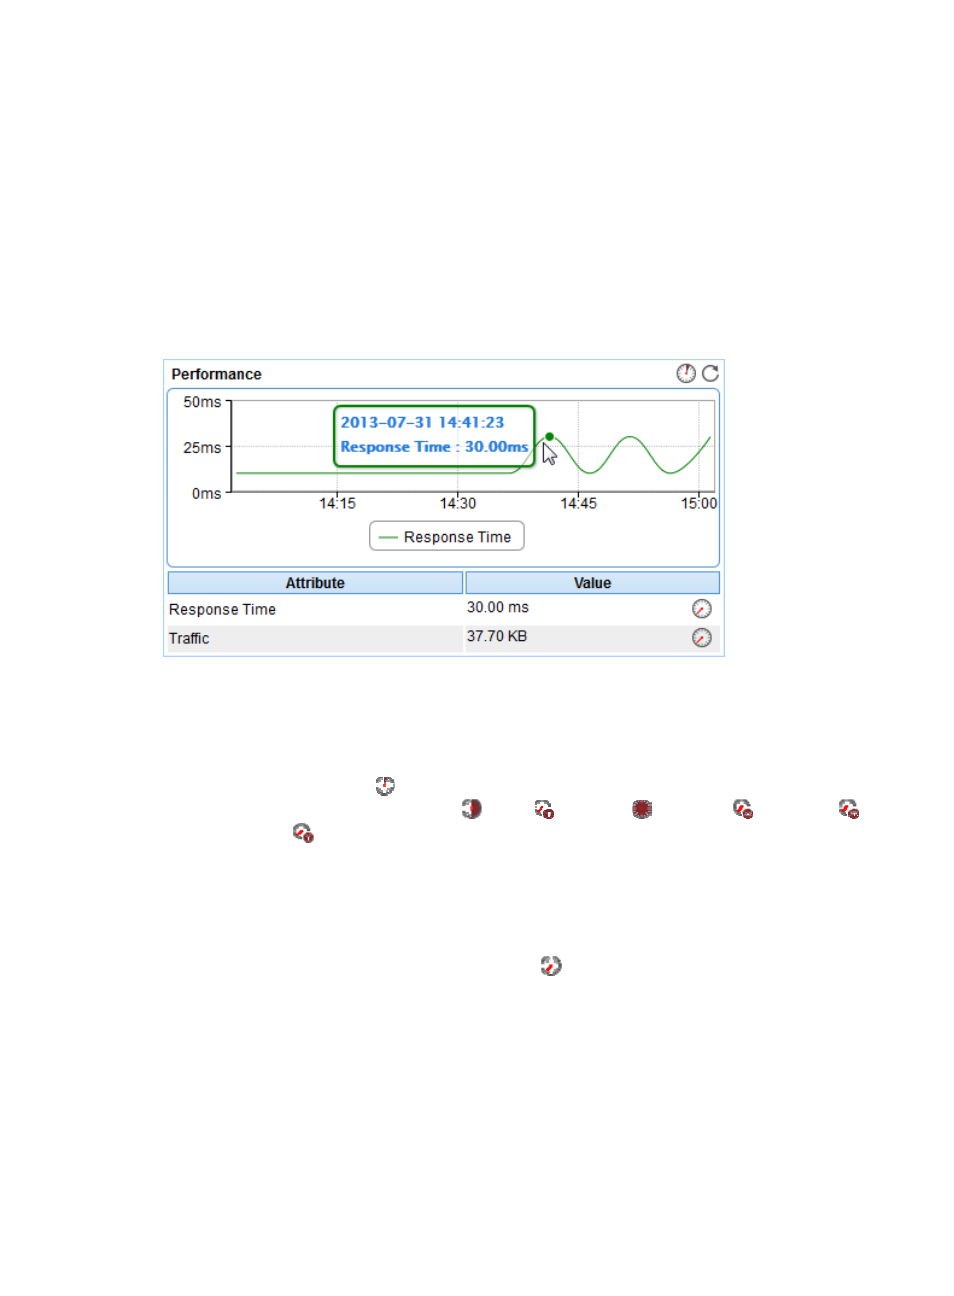
Figure 275 Performance area layout
Performance area fields:
•
Response time trend graph—Shows changes of the response time of the Tomcat server over the
selected time period in a line graph. Point to a spot in the curve to view the response time at the
specific time point. By default, the graph shows the last 1 hour data. To change the report period,
click the Last 1 Hour icon
on the upper right of the graph, and then select an icon from the list.
Available options include Last 6 Hours
, Today
, Yesterday
, This Week
, This Month
,
and This Year
.
•
Attribute/Value—Monitor index name and data.
{
Response Time—Round-trip response time of the Tomcat server in the last polling interval.
{
Traffic—Total number of bytes received and sent by the Tomcat server since the Tomcat server
started in the last polling interval.
{
History Record—Click the History Record icon
for a monitor index to view the history graph
of the response time or traffic trend. Point to a spot on the curve to view the data at the specific
time point. Authorized users can view the statistics over the last 1 hour, last 6 hours, today,
yesterday, this week, this month, and this year by clicking the corresponding icons on the upper
right of the graph.
Memory Usage
The Memory Usage area layout is shown in