Host cpu information – H3C Technologies H3C Intelligent Management Center User Manual
Page 655
641
Memory Information area fields:
•
Trend graph—Shows the memory usage trend of the XenServer server over a specific time range in
a line graph. By default, the graph shows the last hour data. Point to a spot on the curve to view the
memory usage of the XenServer server at the specific time point. To change the report period, click
the Last 1 Hour icon
on the upper right of the graph, and then select an icon from the list.
Available options include the Last 6 Hours icon
, Today icon
, Yesterday icon
, This Week
icon ,
This Month icon
, and This Year icon
.
•
Attribute/Value—Monitored attribute and attribute value.
{
Available XenServer Memory—Available memory space of the XenServer server in the last
polling period.
{
Total XenServer Memory—Total memory space of the XenServer server.
{
Used XenServer Memory—Used memory space of the XenServer server in the last polling
period.
{
XenServer Memory Usage—Memory usage ratio of the XenServer server in the last polling
period.
{
Assigned XAPI Memory—Memory space assigned to XAPI after XAPI is started.
{
Active XAPI Memory—Memory space used by XAPI in the last polling period.
{
Total XAPI Memory—Total memory space for XAPI in the last polling period.
{
Available XAPI Memory—Available memory of XAPI in the last polling period.
{
History Record—Click the History Record icon
to view the history trend for each monitor
index in a line graph. By default, the graph shows the last hour statistics. To change the report
period, click the Last 6 Hours icon ,
Today icon ,
Yesterday icon ,
This Week icon ,
This Month icon ,
or
This Year icon
on the upper right of the graph as needed.
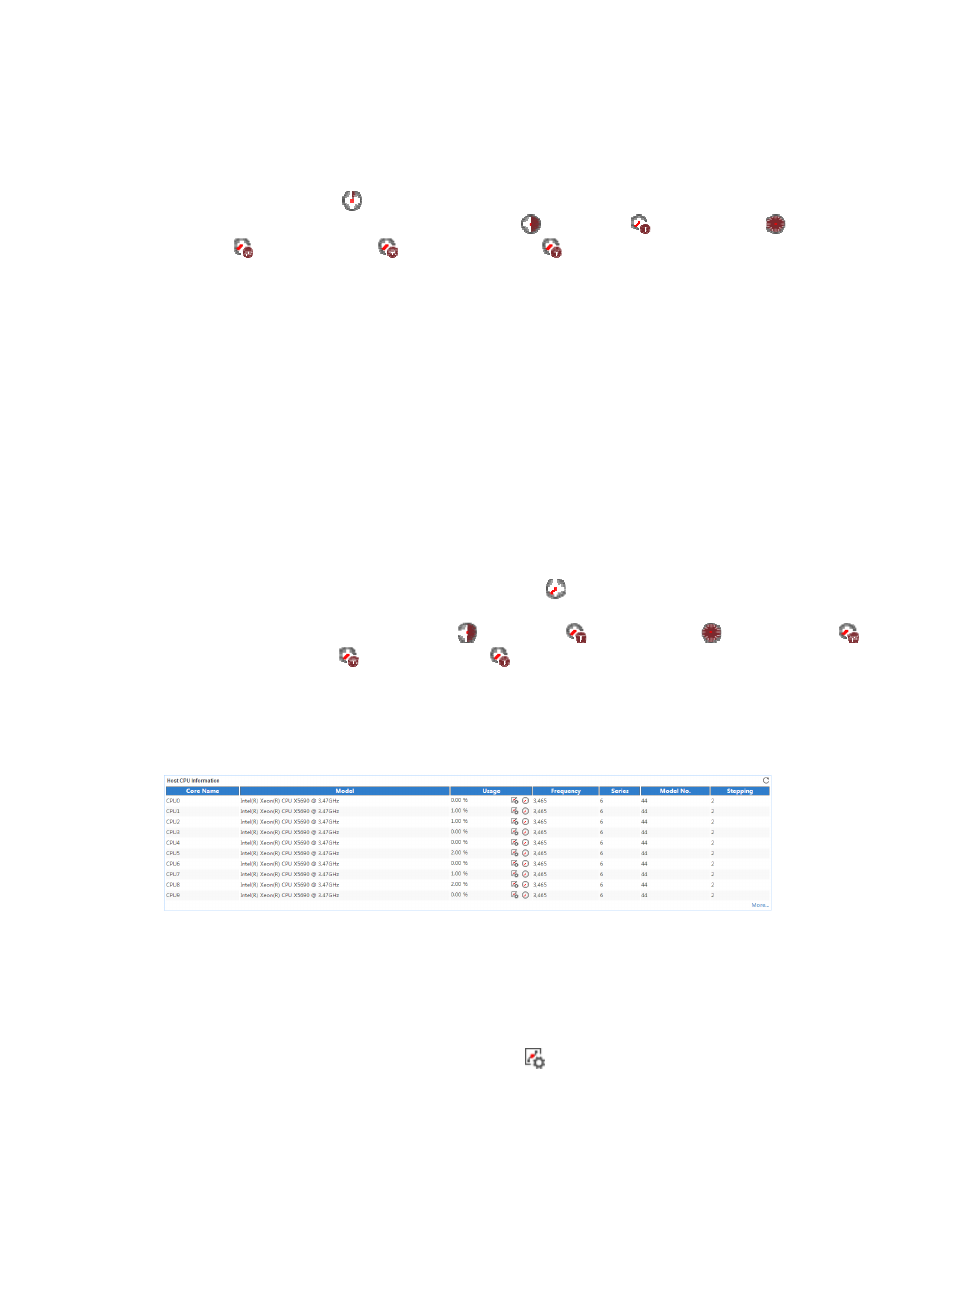
Host CPU Information
The Host CPU Information area is shown in
.
Figure 545 Host CPU Information area layout
Host CPU Information area fields:
•
Core Name—Name of the CPU core.
•
Model—Model of the CPU.
•
Usage—Usage ratio of the CPU core in the last polling period.
{
Set Threshold—Click the Set Threshold icon
to set alarm thresholds for the CPU core usage
ratio. The data is highlighted in orange when the CPU core usage ratio reaches the level-1
threshold, and is highlighted in red when the CPU core usage ratio reaches the level-2 threshold.
Use the global thresholds or custom thresholds. For information about setting thresholds, see "