Zombie process number, Zombie process – H3C Technologies H3C Intelligent Management Center User Manual
Page 164
150
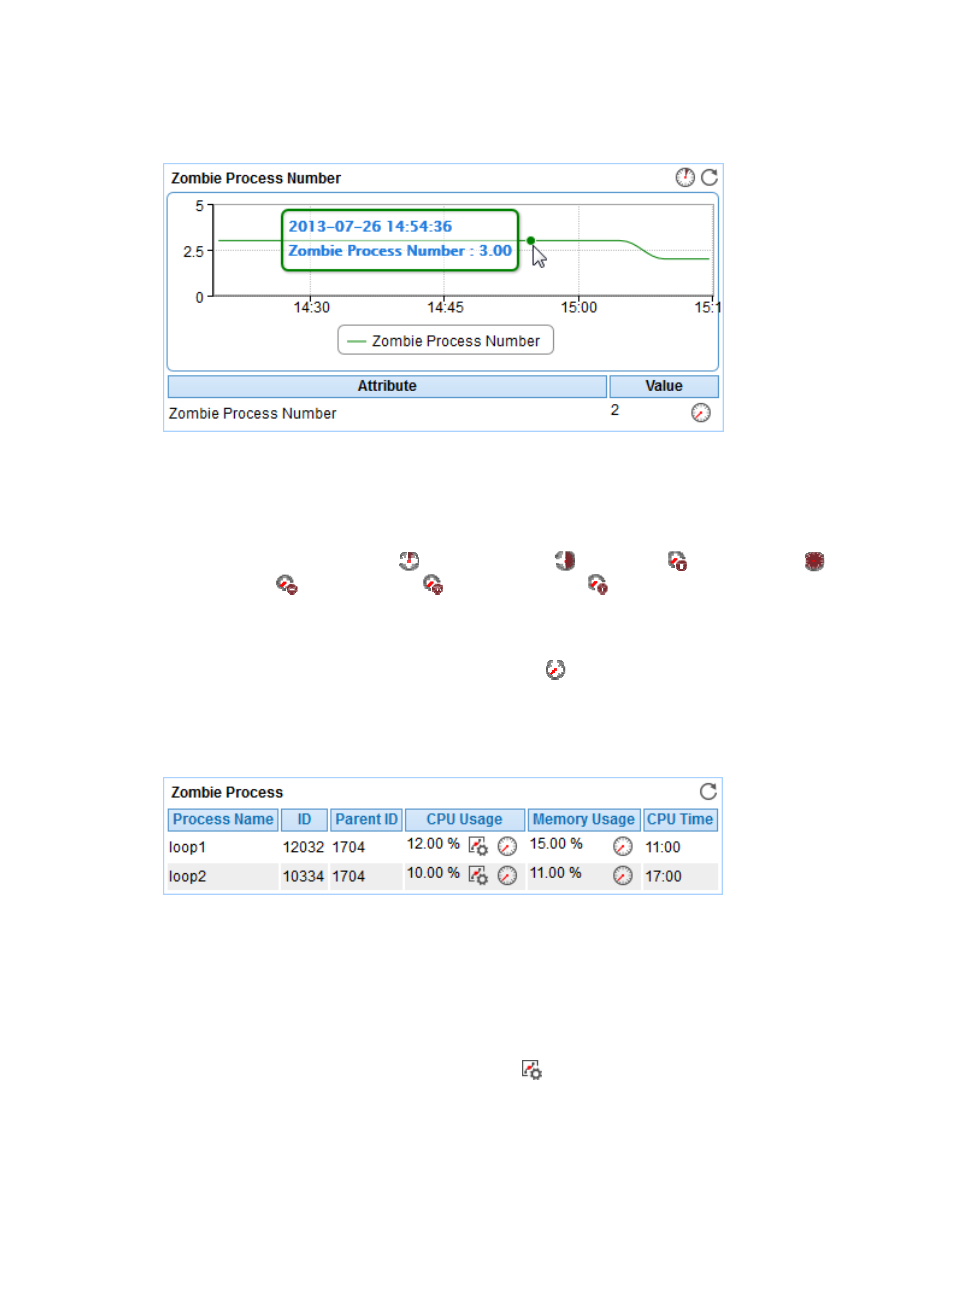
Zombie Process Number
Figure 98 Zombie Process Number area layout
Zombie Process Number area fields:
•
Zombie Process Number trend graph—Shows the change trend of the zombie process number over
the last 1 hour. Point to a spot on the curve to view the number of zombie processes at the specified
time point. View the changes of the zombie process number over the specified time period by
clicking the Last 1 Hour icon
, Last 6 Hours icon
, Today icon
, Yesterday icon
, This
Week icon
, This Month icon
, and This Year icon
.
•
Attribute/Value—Monitor index name and data.
{
Zombie Process Number—Number of zombie processes in the most recent polling interval.
{
History Record—Click the History Record icon
to view the change trend of the zombie
process number in last 1 hour, last 6 hours, today, yesterday, this week, this month, or this year.
Zombie Process
Figure 99 Zombie process area layout
Zombie Process area fields:
•
Process Name—Name of the zombie process in the most recent polling interval.
•
ID—ID of the zombie process in the most recent polling interval.
•
Parent ID—ID of the parent process for the zombie process in the most recent polling interval.
•
CPU Usage—CPU usage of the zombie process in the most recent polling interval.
{
Set Threshold—Click the Set Threshold icon
to set alarm thresholds for the CPU usage of the
zombie process. The data is highlighted in orange when the CPU usage of the zombie process
reaches the level-1 threshold, and is highlighted in red when the CPU usage of the zombie
process reaches the level-2 threshold. You can set global thresholds or custom thresholds. For
information about setting the thresholds, see "