Thread details, Web application – H3C Technologies H3C Intelligent Management Center User Manual
Page 383
369
{
History Record—Click the History Record icon
to view the history graph of the memory
usage trend of the GlassFish server. Point to a spot on the curve to view the data at the specific
time point. Authorized users can view the statistics over the last 1 hour, last 6 hours, today,
yesterday, this week, this month, and this year by clicking the corresponding icons on the upper
right of the graph.
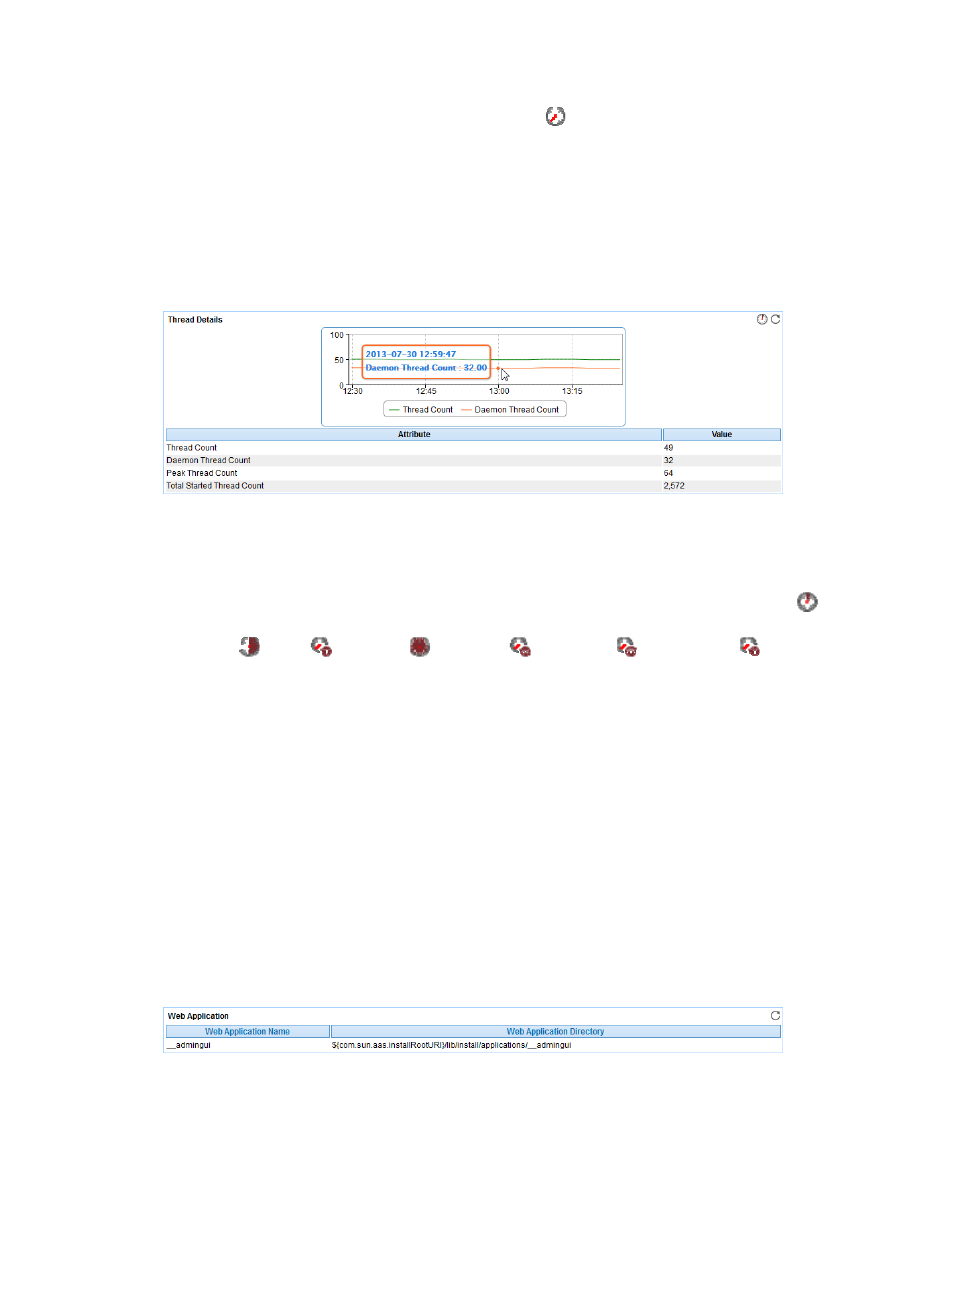
Thread Details
The Thread Details area layout is shown in
Figure 309 Thread Details area layout
Thread Details area fields:
•
Thread count trend graph—Shows changes of the thread count and daemon thread count of the
GlassFish server over the last 1 hour. The green curve shows the thread count and the orange curve
shows the daemon thread count. To change the report period, click the Last 1 Hour icon
on the
upper right of the graph, and then select an icon from the list. Available options include Last 6
Hours
, Today
, Yesterday
, This Week
, This Month
, and This Year
. Point to a spot
on the curve to view the thread count and daemon thread count at the specific time point.
•
Attribute/Value—Monitor index name and data.
{
Thread Count—Total number of threads used for processing HTTP requests in the last polling
interval.
{
Daemon Thread Count—Total number of daemon threads of the GlassFish server in the last
polling interval.
{
Peak Thread Count—Maximum number of threads of the GlassFish server since the server
started until the last polling interval.
{
Total Started Thread Count—Total number of threads the GlassFish server had created and run
since the server started until the last polling interval.
Web Application
The Web Application area is as shown in
.
Figure 310 Web Application area layout
Web Application area fields:
•
Web Application Name—Name of the Web application.
•
Web Application Directory—Directory that locates the project file of the Web application on the
GlassFish server.