Network interface – H3C Technologies H3C Intelligent Management Center User Manual
Page 237
223
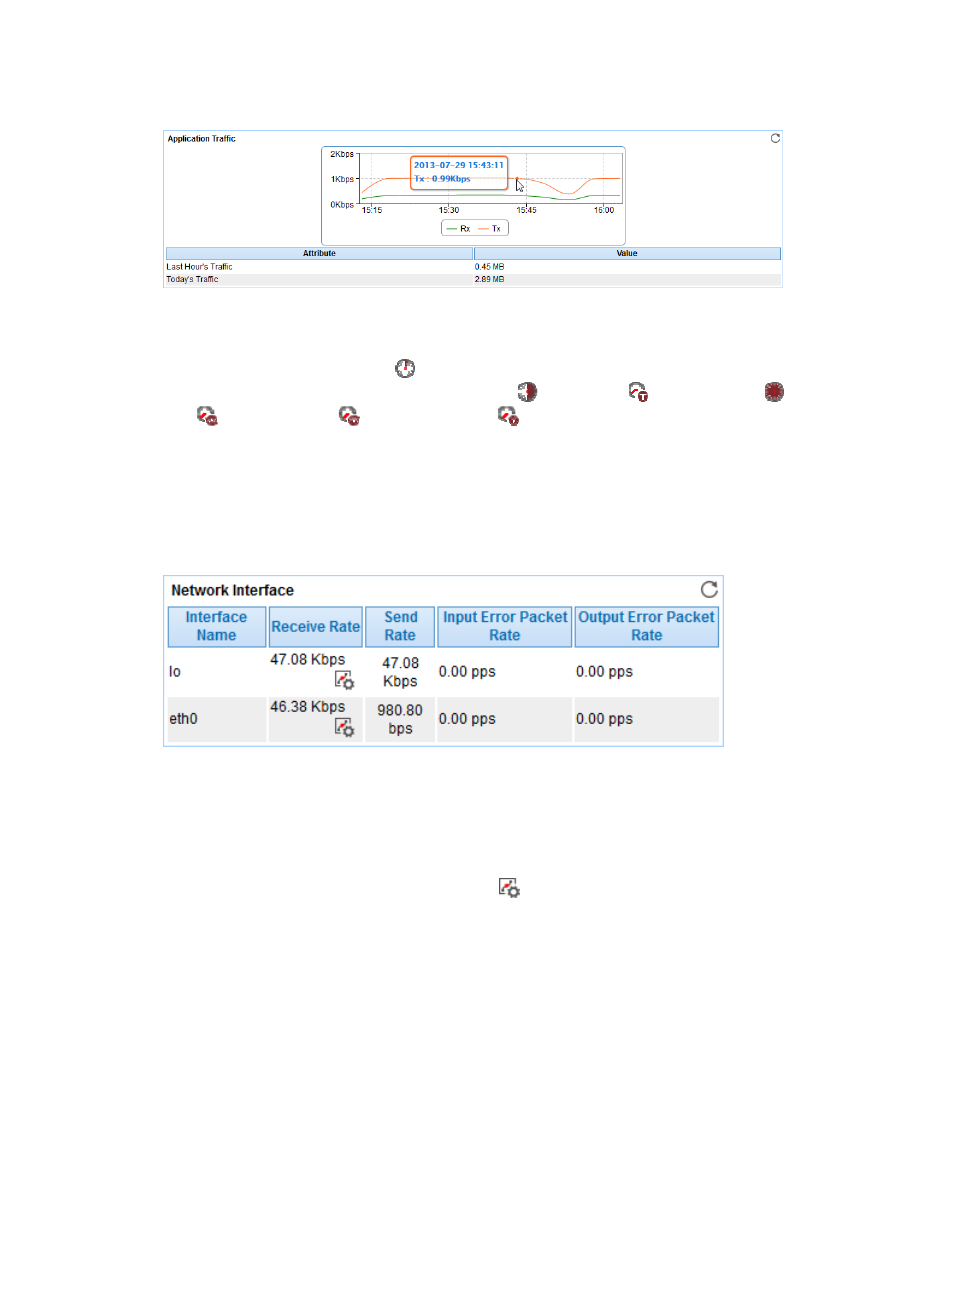
Figure 173 Application Traffic area layout
The Application Traffic trend graph shows changes of inbound and outbound traffic over the last 1 hour.
The green curve shows the inbound traffic and the orange the outbound traffic. To change the report
period, click the Last 1 Hour icon
on the upper right of the graph, and then select an icon from the
list. Available options include the Last 6 Hours icon ,
Today icon
, Yesterday icon
, This Week
icon
, This Month icon
, and This Year icon
. Point to a spot on the curve to view the application
traffic at the specific time point. Click a legend name to display or hide the corresponding monitor index
in the graph.
Network Interface
The Network Interface area layout is shown in
.
Figure 174 Network Interface area layout
Network Interface area fields:
•
Interface Name—Identifier of a network interface card in Linux. APM monitors both physical and
virtual (logical) network interface cards.
•
Receive Rate—Receive rate of a network interface card in the last APM polling period.
Set Threshold—Click the Set Threshold icon
to set alarm thresholds for the receive rate of Linux
network interface cards. The data is highlighted in orange when receive rate reaches the level-1
threshold, and is highlighted in red when receive rate reaches the level-2 threshold. Use the global
thresholds or custom thresholds. For information about setting the thresholds, see "
."
•
Send Rate—Send rate of a network interface card in the last APM polling period.
{
Input Error Packet Rate—Number of lost inbound error packets per second on a network
interface card in the last APM polling period.
{
Output Error Packet Rate—Number of lost outbound error packets per second on a network
interface card in the last APM polling period.