File system usage ratio – H3C Technologies H3C Intelligent Management Center User Manual
Page 215
201
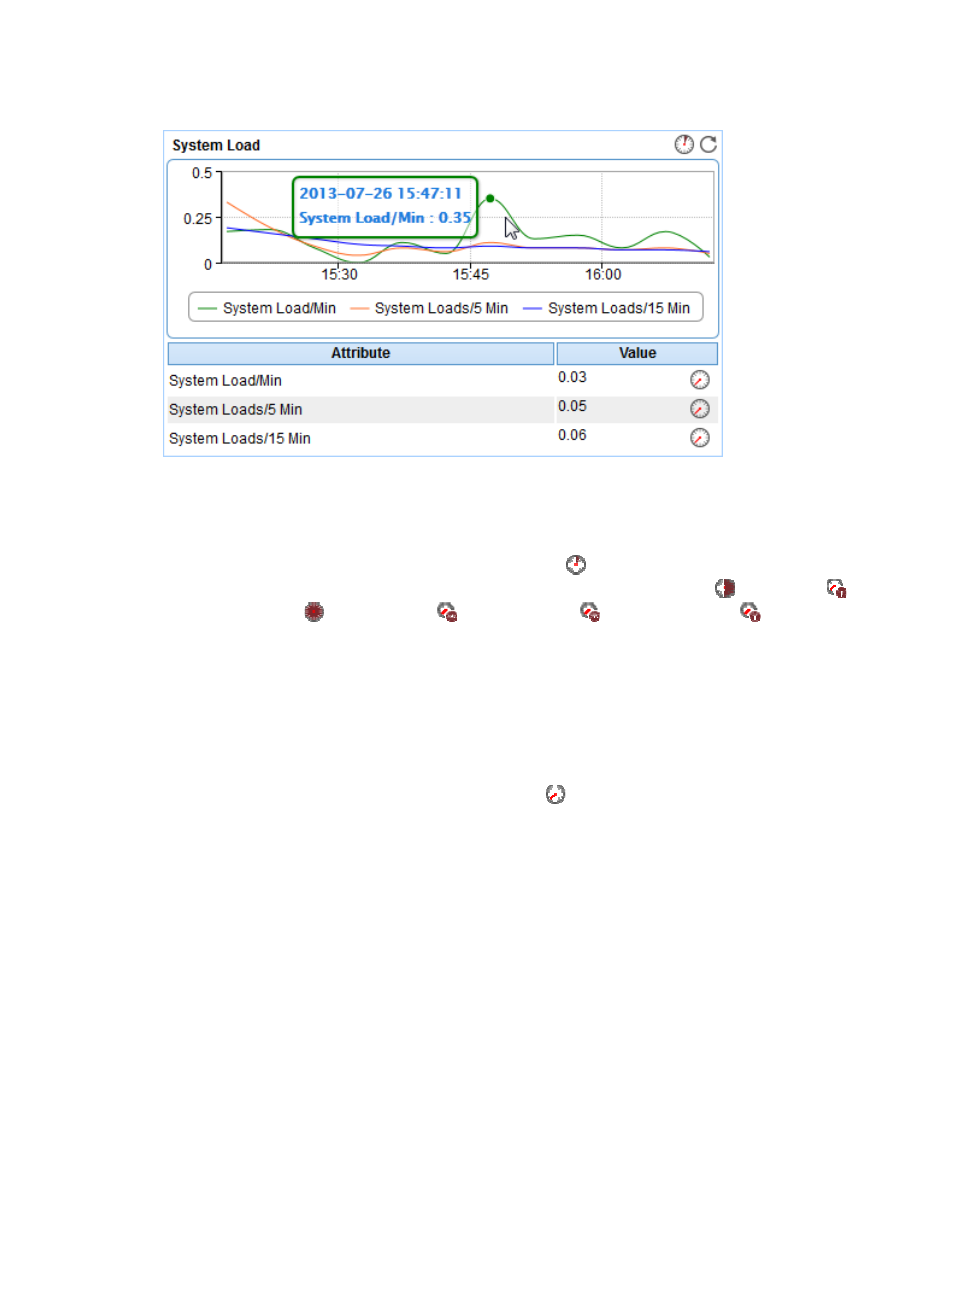
Figure 150 System Load area layout
System Load area fields:
•
System Load trend graph—Shows the system load trend of HP-UX over the last 1 hour. The green
curve shows the system load over 1 minute, the orange over 5 minutes, and the blue over 15 minutes.
To change the report period, click the Last 1 Hour icon
on the upper right of the graph, and then
select an icon from the list. Available options include the Last 6 Hours icon
, Today icon
,
Yesterday icon
, This Week icon
, This Month icon
, and This Year icon
. Point to a spot
on the curve to view the system load at the specific time point. Click the legend names to display or
hide the corresponding monitor indexes.
•
Attribute/Value—Monitor index name and data that was obtained when APM last polled HP-UX.
{
System Load/Min—Average system load over the last 1 minute.
{
System Load/5 Min—Average system load over the last 5 minutes.
{
System Load/15 Min—Average system load over the last 15 minutes.
{
History Record—Click the History Record icon
to view the history graph of the average
system load trend. Point to a spot on the curve to view the data at the specific time point.
Authorized users can view system load statistics over the last 1 hour, last 6 hours, today,
yesterday, this week, this month, and this year by clicking the corresponding icons.
File System Usage Ratio
The HP-UX file directory structure contains one root directory and multiple subdirectories. File systems are
mounted to the root directory or subdirectories under the root directory. Each file system corresponds to
a physical disk partition or logical volume. Use the File System Usage Ratio area to display how the
available disk space is used. Its area layout is shown in