Database details, Process details, Transaction details – H3C Technologies H3C Intelligent Management Center User Manual
Page 318
304
Week
, This Month
, and This Year
. Point to a spot on the curve to view the application
traffic at the specific time point. Click Rx or Tx to display or hide the corresponding monitor index
in the graph.
•
Attribute/Value—Monitor index name and data that was obtained when APM last polled Sybase.
{
Last Hour's Traffic—Total traffic sent and received by Sybase over the last 1 hour.
{
Today's Traffic—Total traffic sent and received by Sybase since 00:00 today.
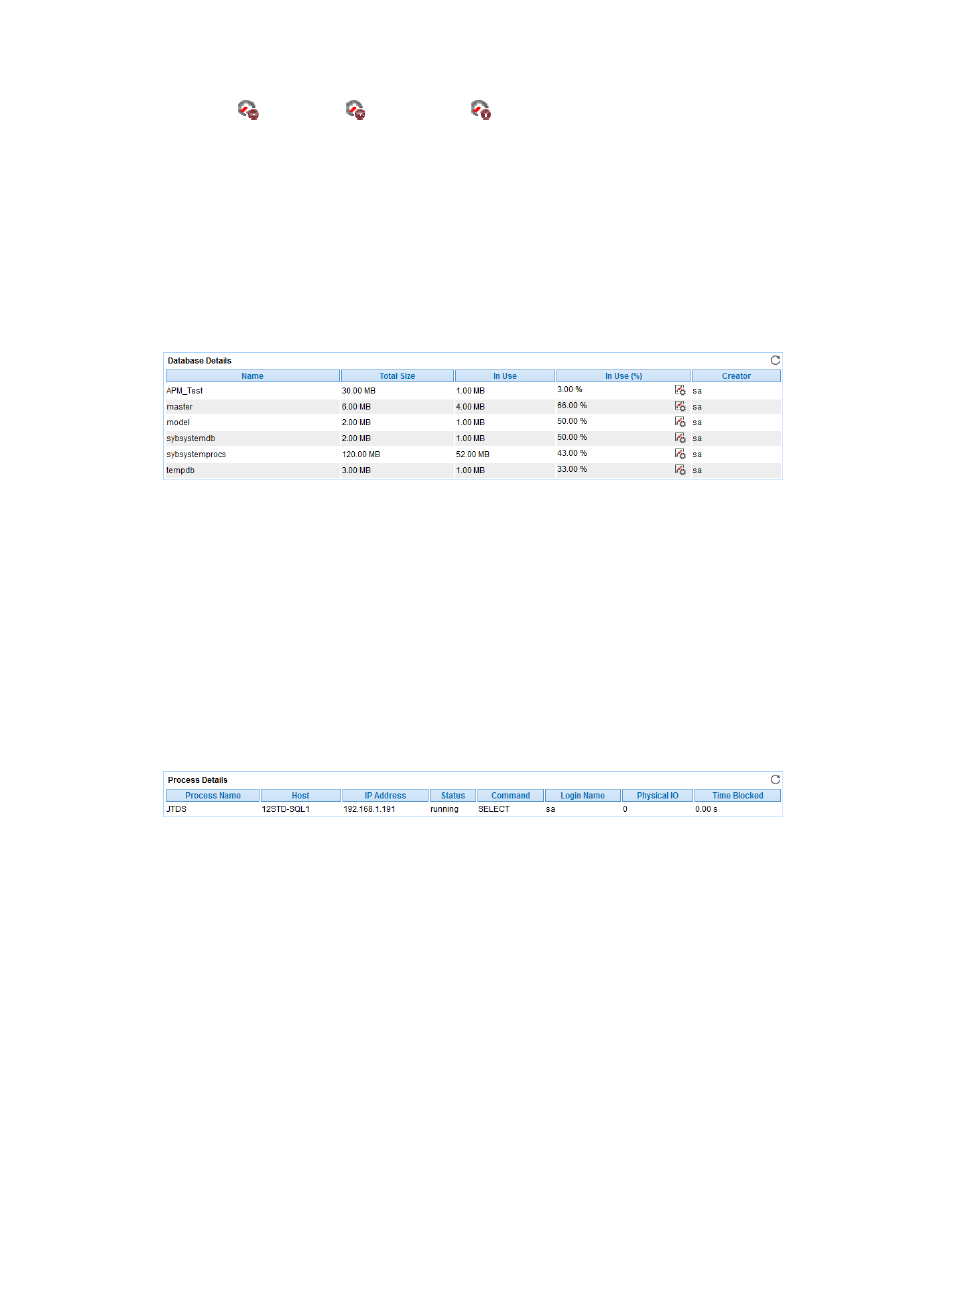
Database Details
The Database Details area layout is shown in
Figure 252 Database Details area layout
Database Details area fields:
•
Name—Name of the database the Sybase accessed when APM last polled Sybase.
•
Total Size—Total size of the disk space assigned to the database.
•
In Use—Used disk space.
•
In Use (%)—Ratio of used disk space to total disk space.
•
Creator—User account that created the database.
Process Details
The Process Details area layout is shown in
.
Figure 253 Process Details area layout
Process Details area fields:
•
Process Name—Name of the process.
•
Host—Name of the host where the process is.
•
IP address—IP address of the host.
•
Status—Status of the process.
•
Command—Type of the command that was being executed.
•
Login Name—Name of the account that logged in to Sybase.
•
Physical IO—Physical IO for the process.
•
Time Blocked—Duration for how long the process is blocked.
•
More—Click More to display all processes that accessed the Sybase.
Transaction Details
The Transaction Details area layout is shown in
.