Adobe Illustrator CS3 User Manual
Page 456
ILLUSTRATOR CS3
User Guide
450
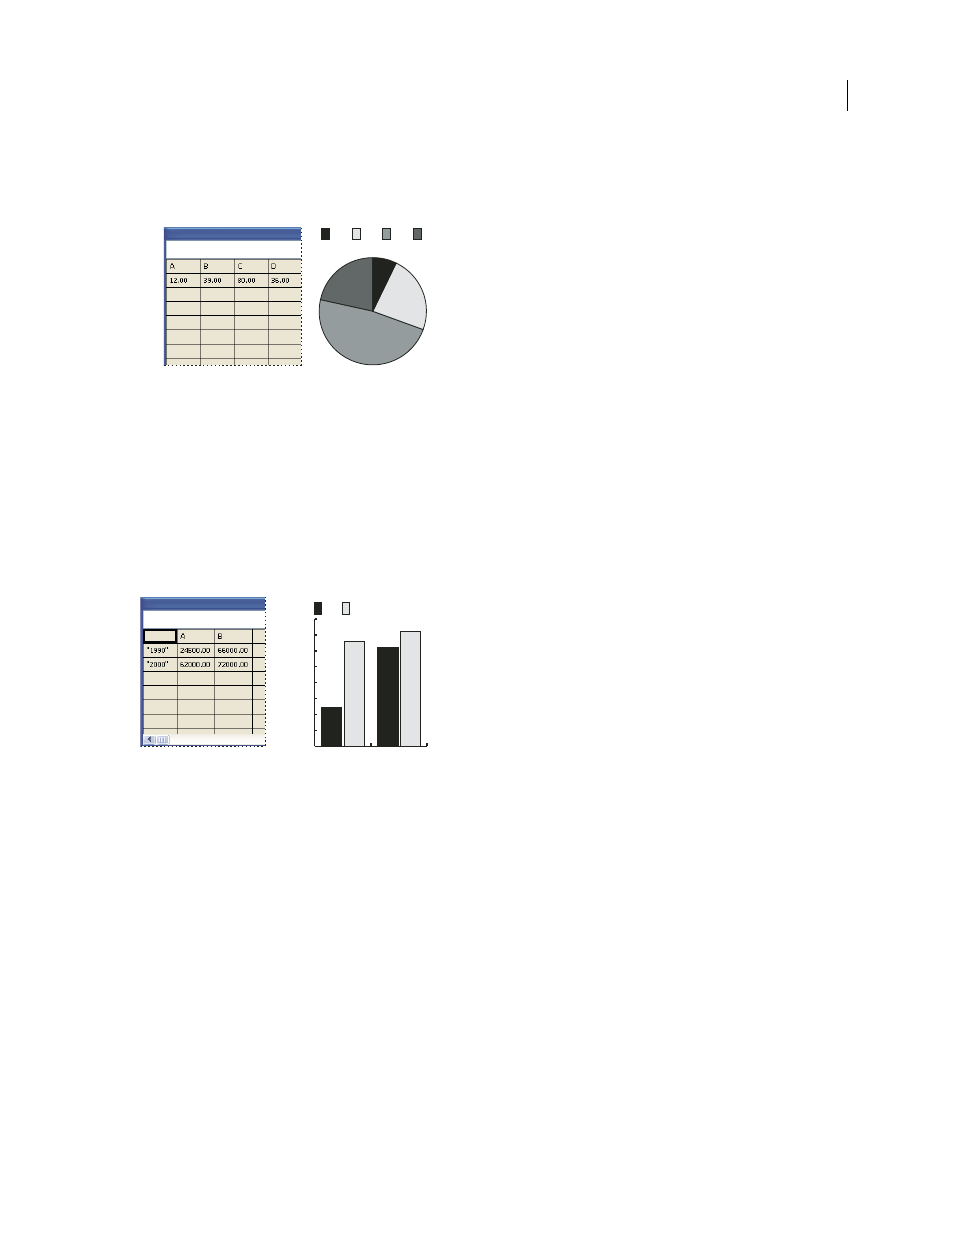
Enter data sets for pie graphs
You organize data sets for pie graphs similarly to other graphs. However, each row of data in the worksheet generates
a separate graph.
Pie graph data
•
Enter data-set labels as for column, stacked column, bar, stacked bar, line, area, and radar graphs. Enter category
labels if you want to generate graph names.
•
To create a single pie graph, plot only one row of data, either all positive or all negative values.
•
To create multiple pie graphs, plot additional rows of data, either all positive or all negative values. By default, the
size of the individual pie graphs is proportional to the total of each graph’s data.
Enter data sets for column, bar, line, area, and radar graphs
After you enter the labels for your graph, you’re ready to enter each set of data under the appropriate column.
Column graph data
Column, stacked column, bar, stacked bar graphs
The height of the column or length of the bar corresponds to the
amount being compared. For column or bar graphs, you can combine positive and negative values; negative values
appear as columns extending below the horizontal axis. For stacked column graphs, numbers must be all positive or
all negative.
Line graphs
Each column of data corresponds to one line in the line graph. You can combine positive and negative
values in a line graph.
Area graphs
Values must be all positive or all negative. Each row of data entered corresponds to a filled area on the
area graph. Area graphs add each column’s values to the previous column’s totals. Therefore, even if area graphs and
line graphs contain the same data, they appear substantially different.
Radar graphs
Each number is plotted on an axis and connected to the others in the same axis to create a “web.” You
can combine positive and negative values in a radar graph.
D
C
B
A
0
10000
20000
30000
40000
50000
60000
70000
80000
B
A
2000
1990