Teledyne LeCroy SierraFC M8-4 User Manual User Manual
Page 36
Teledyne LeCroy
Easy Mode (Pre‐Defined Setups)
36
SierraFC M8‐4 Protocol Analyzer User Manual
2. The analyzer begins filling the defined memory buffer with traffic on the bus. After
the traffic fills the memory buffer, the traffic is uploaded to the viewer and all views
are displayed, except the Statistical Report View.
3. Spreadsheet View is the default display. However, you can view results in any of the
different views by selecting View on the menu bar and choosing the desired View.
Note: the software remembers the last view (or views combination) used, and will
automatically use that next time it is launched.
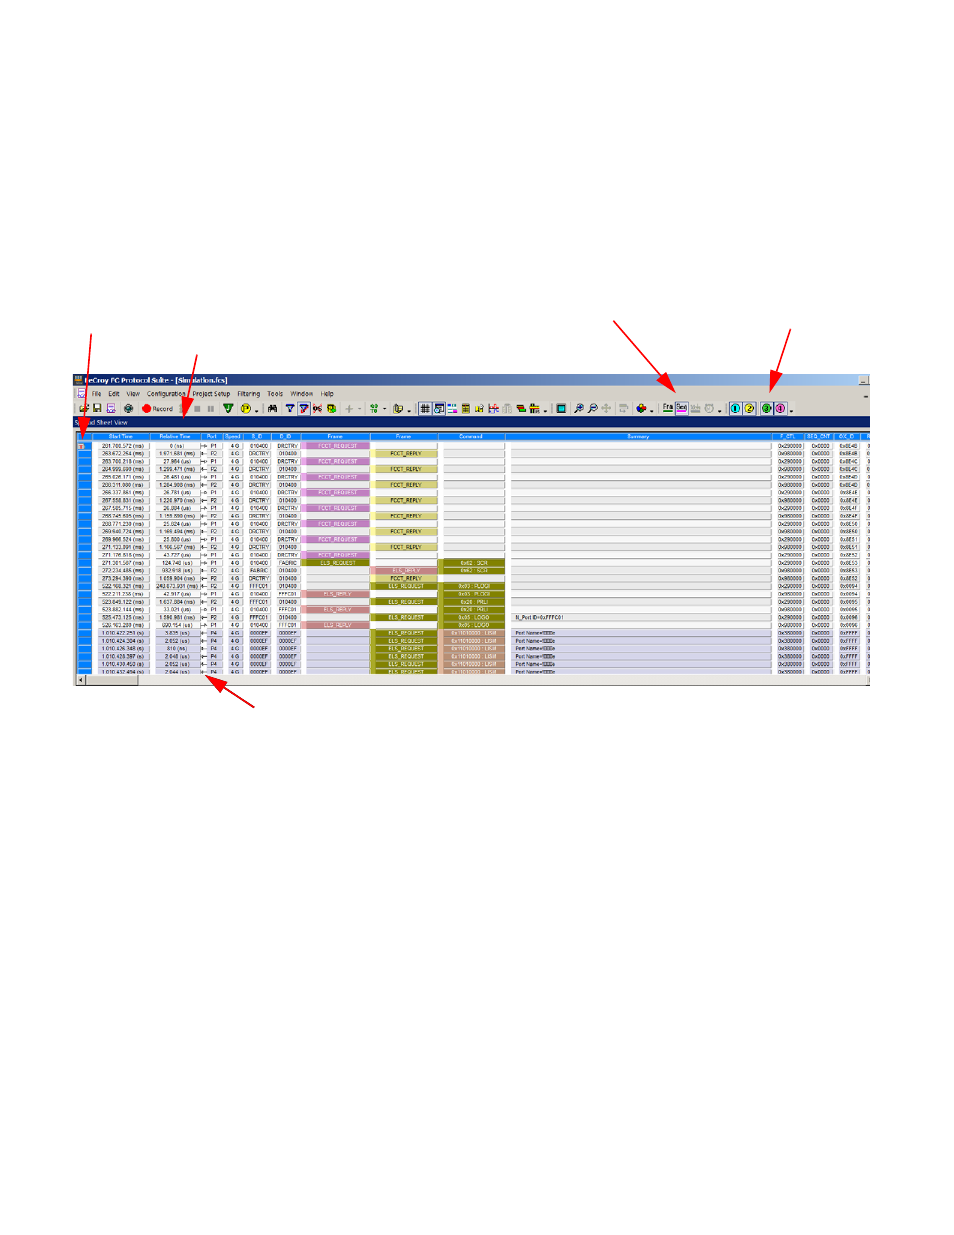
Figure 2.5: Typical Spreadsheet View Results Display
The results display shows each transaction for every layer identified in a different color
and the data direction identified with data direction arrows. Upstream traffic has an
arrow from right to left:. Downstream traffic has an arrow left to right: .
You can hide any layer by clicking the corresponding Show/Hide button on the menu bar.
The system retains all captured data, but the display has only some data layers for simpler
viewing.
You can configure the viewer display for test and viewing preferences (see
for details about configuring the viewer display).
The Analysis Project dialog offers you a comprehensive set of choices to create a trigger
and capture project satisfying some specific need. You can set the Analyzer to:
Capture specific patterns (see
“Patterns and Data Capture Setup” on page 40
).
Capture different patterns pre‐ and post‐trigger (see
Exclude parameters from capture (see
“Patterns and Data Capture Setup” on
Show/Hide Protocol Layers
X,Y,T Cursors
Show/Hide port data
Data direction arrows
Relative time display (Between two sequential
packets on the same layer and port)