Traffic view – Brocade Virtual ADX Graphical User Interface Guide (Supporting ADX v03.1.00) User Manual
Page 25

Brocade Virtual ADX Graphical User Interface Guide
13
53-1003242-01
Traffic view
3
Traffic view
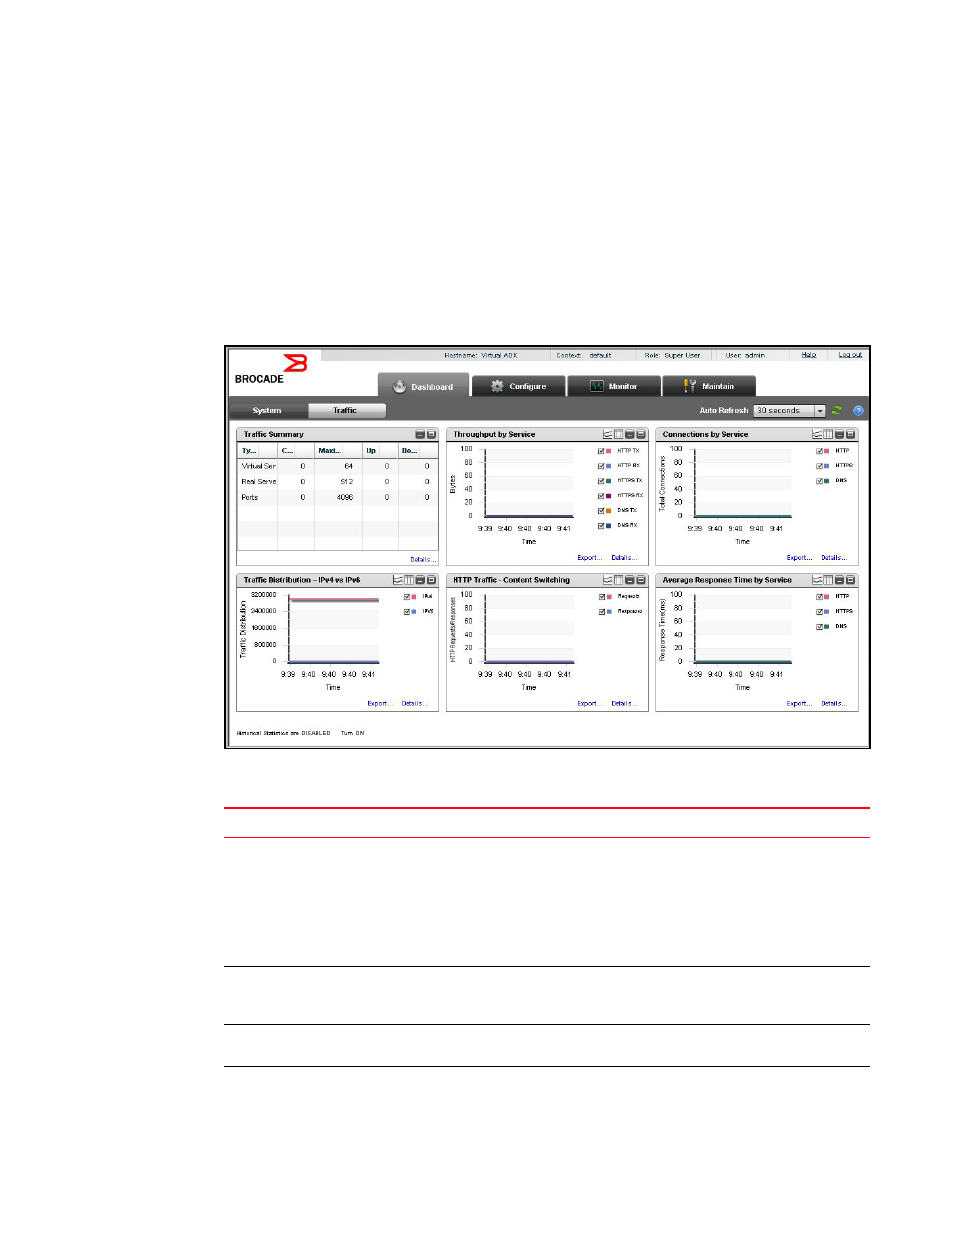
The Traffic dashboard displays network traffic information including traffic distribution, sessions
and connections for service, and service response time.
To view the Traffic dashboard, select the Dashboard tab in the task bar and click Traffic on the
menu bar.
The Traffic dashboard page is displayed, as shown in
.
FIGURE 7
Traffic dashboard
The Traffic dashboard contains six pods. See
.
TABLE 3
Traffic dashboard pods
Pod
Description
Traffic Summary
Allows you to monitor the status of the virtual servers, real servers, and
ports configured on the Brocade Virtual ADX in a tabular format. You can
also monitor the following:
•
Total count of virtual servers, real servers, and ports.
•
Maximum number virtual servers, real servers, and ports that can be
configured on the Brocade Virtual ADX.
•
Number of virtual servers, real servers, and ports that are disabled.
Throughput by Service
Allows you to monitor the transmission and reception of packets in bits per
seconds (BPS) over time based on Hypertext Transfer Protocol (HTTP),
Hypertext Transfer Protocol secure (HTTPS), Domain Name System (DNS).
Connections by Service
Allows you to monitor the sessions over time based on HTTP, HTTPS, and
DNS.
Traffic Distribution - IPv4 vs IPv6
Allows you to monitor the client traffic based on IPv4 versus IPv6.
