Brocade Virtual ADX Graphical User Interface Guide (Supporting ADX v03.1.00) User Manual
Page 184
172
Brocade Virtual ADX Graphical User Interface Guide
53-1003242-01
Navigating the monitor tab
10
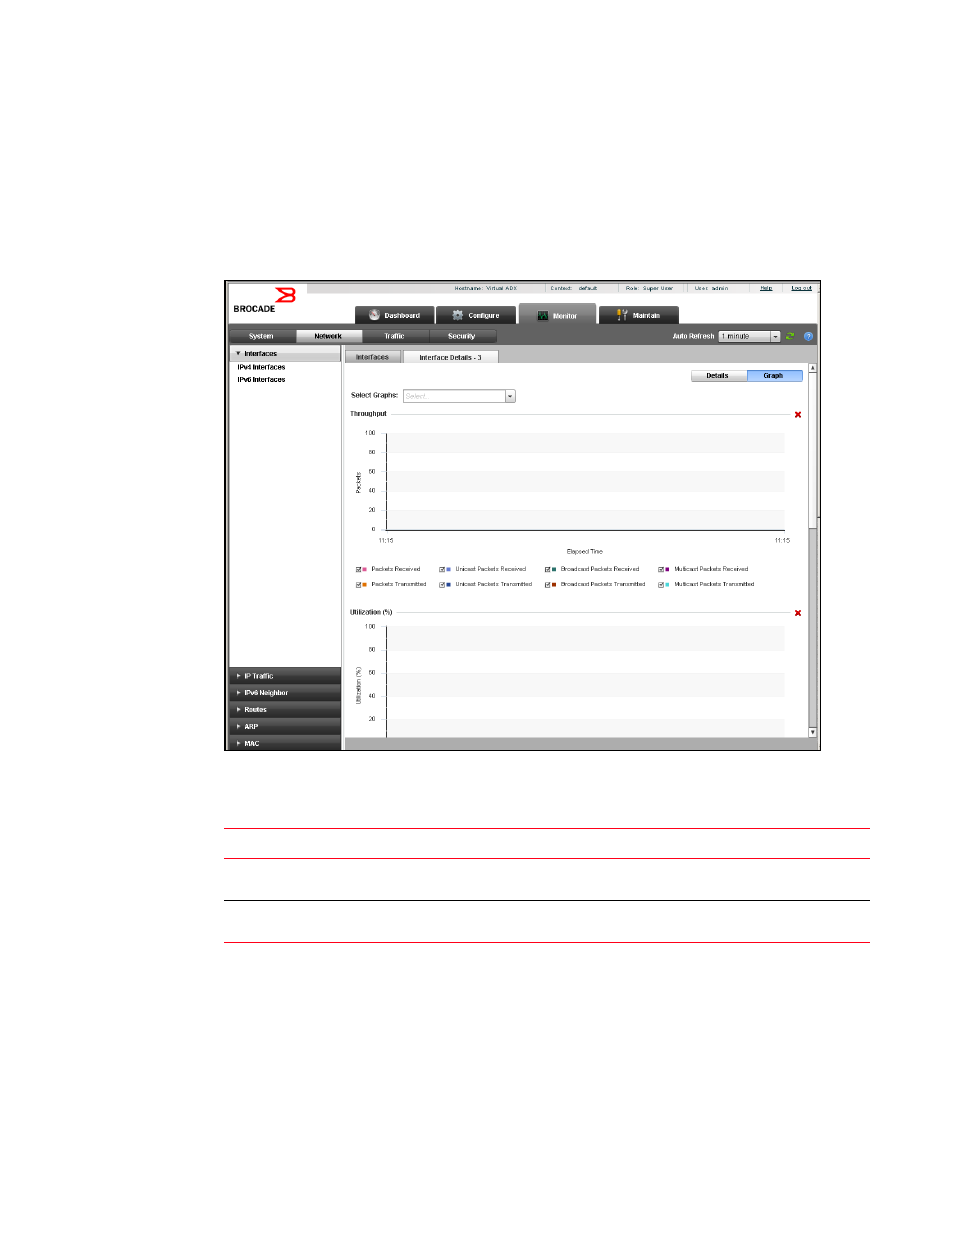
In graphical view, some of the graphs appear by default. To view or hide the graphs based on
various networking parameters, select or clear the check boxes corresponding to the graphs that
you want to view from the Select Graph list displayed in top right corner of the Details page. You can
also click the close button that is displayed on the each individual graphs to close the graph. Select
the legend check boxes to plot the relevant statistics data on the graph.
FIGURE 134
IP graphical view
There are common icons that are displayed on the top right corner of all the main pages within the
Monitor tab. The following table describes the icons displayed on the main page:
TABLE 34
Monitoring icons
Icon
Description
Filter
Allows you to filter the data in the Summary page. Click the Filter icon and
select the criteria from the Filter
Criteria list.
Auto refresh
Refresh the monitoring page based on the changes made to the
configuration. Select the interval at which the page has to refreshed.
- ICX 6650 Hardware Installation Guide (98 pages)
- FastIron Ethernet Switch Administration Guide (362 pages)
- FastIron Ethernet Switch Feature and RFC Support Matrix (66 pages)
- FastIron Ethernet Switch Traffic Management Guide (100 pages)
- FastIron Ethernet Switch Stacking Configuration Guide (160 pages)
- FastIron Ethernet Switch Software Upgrade Guide (121 pages)
- FastIron Ethernet Switch Software Licensing Guide (58 pages)
- FastIron Ethernet Switch Security Configuration Guide (396 pages)
- FastIron Ethernet Switch Platform and Layer 2 Switching Configuration Guide (454 pages)
- FastIron Ethernet Switch Layer 3 Routing Configuration Guide (672 pages)
- FastIron Ethernet Switch IP Multicast Configuration Guide (230 pages)
- FastIron SX, FCX, and ICX Diagnostic Reference (222 pages)
- ICX 7750 Hardware Installation Guide (80 pages)
- Network OS YANG Reference Manual v4.1.1 (238 pages)
- Network OS Software Licensing Guide v4.1.0 (34 pages)
- Network OS NETCONF Operations Guide v4.1.1 (622 pages)
- Network OS Message Reference v4.1.1 (478 pages)
- Network OS Feature and RFC Support Matrix (16 pages)
- Network OS Command Reference v4.1.0 (1418 pages)
- Network OS Administrator’s Guide v4.1.1 (748 pages)
- Mid-Mount Rack Kit (Switch) Installation Procedure (Supporting 300, 5100, 5300, 6505, 6510, 6520, 7800, 8000, VA-40FC, VDX 6710-54, and VDX 6740) (10 pages)
- Flush Mount Rack Kit Installation Procedure (Supporting VDX 6710-54, VDX 6720-24, VDX 6720-60, VDX 6730-32, VDX 6730-76, and VDX 6740) (10 pages)
- VDX 6710-54 QuickStart Guide (12 pages)
- VDX 6710-54 Hardware Reference Manual (72 pages)
- VDX 6730 Hardware Reference Manual (Supporting VDX 6730-32 and VDX 6730-76) (90 pages)
- VDX 6730 QuickStart Guide (Supporting VDX 6730-32 and VDX 6730-76) (12 pages)
- Fixed Rack Mount Kit Installation Procedure (Supporting 300, 5100, 5300, 6520, 7800, 8000) (12 pages)
- VDX 8770-8 Two-Post Flush and Mid-Mount Rack Kit Installation Procedure (8 pages)
- VDX 8770-8 QuickStart Guide (34 pages)
- VDX 8770-8 Hardware Reference Manual (136 pages)
- VDX 8770-8 Four-Post Flush and Recessed Mount Rack Kit Installation Procedure (10 pages)
- VDX 8770-4 Two-Post Flush and Mid-Mount Rack Kit Installation Procedure (10 pages)
- VDX 8770-4 QuickStart Guide (32 pages)
- VDX 8770-4 Hardware Reference Manual (132 pages)
- VDX 8770-4 Four-Post Flush Mount Rack Kit Installation Procedure (8 pages)
- VDX 8770-4 Four-Post Flush and Recessed Mount Intake Air Duct Rack Kit Installation Procedure (24 pages)
- VDX 6740 Hardware Reference Manual (Supporting VDX 6740, VDX 6740T, and VDX 6740T-1G) (78 pages)
- Universal Four Post Rack Kit Installation Procedure (Supporting VDX 6740T) (20 pages)
- Universal Two-Post Rack Kit Installation Procedure (Supporting VDX 6740T) (12 pages)
- FCX Series Hardware Installation Guide (112 pages)
- 6910 Ethernet Access Switch MIB Reference (102 pages)
- 6910 Ethernet Access Switch Hardware Installation Guide (84 pages)
- 6910 Ethernet Access Switch Diagnostic Guide (Supporting R2.2.0.0) (88 pages)
- 6910 Ethernet Access Switch Configuration Guide (Supporting R2.2.0.0) (1240 pages)
- Unified IP MIB Reference (Supporting Multi-Service IronWare Release 05.6.00a) (771 pages)