Dashboard pod controls, Displaying dashboard pod line graph data, Changing dashboard pod line graph data time period – Brocade Virtual ADX Graphical User Interface Guide (Supporting ADX v03.1.00) User Manual
Page 21
Brocade Virtual ADX Graphical User Interface Guide
9
53-1003242-01
Dashboard overview
3
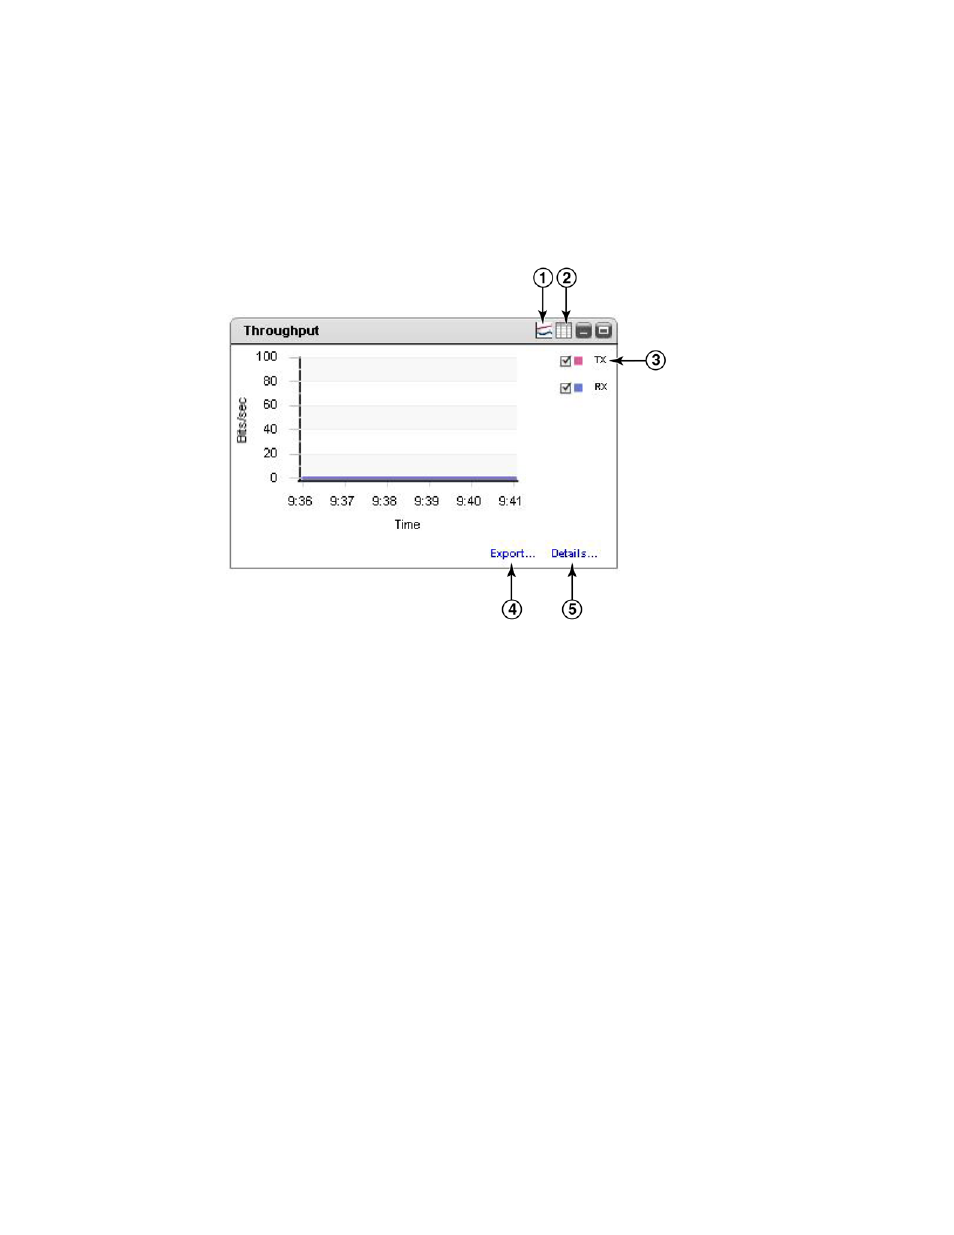
Dashboard pod controls
The Dashboard pods support variable data display, time-period selection, and data export on a
case-by-case basis.
FIGURE 4
Dashboard pod controls
Displaying dashboard pod line graph data
Some pods allow you to select the data to be displayed. Clicking on the check boxes inside the pods
toggles the display of the value on and off. It does not stop the collection of that data.
Changing dashboard pod line graph data time period
Some pods allow you to change the time period for the data being displayed.
See the Historical Statistics status in the bottom left corner of the Dashboard tab. To enable the
time period controls:
1. Click Turn ON to toggle the display of the pods time period controls for those pods.
2. Each pod’s time period display is independent of any other. Select the time period you want
displayed for each pod.
1
Display pod data in graph format
2
Display pod data in a spreadsheet
3
Toggle data display
4
Export data
5
Jump to source page
- ICX 6650 Hardware Installation Guide (98 pages)
- FastIron Ethernet Switch Administration Guide (362 pages)
- FastIron Ethernet Switch Feature and RFC Support Matrix (66 pages)
- FastIron Ethernet Switch Traffic Management Guide (100 pages)
- FastIron Ethernet Switch Stacking Configuration Guide (160 pages)
- FastIron Ethernet Switch Software Upgrade Guide (121 pages)
- FastIron Ethernet Switch Software Licensing Guide (58 pages)
- FastIron Ethernet Switch Security Configuration Guide (396 pages)
- FastIron Ethernet Switch Platform and Layer 2 Switching Configuration Guide (454 pages)
- FastIron Ethernet Switch Layer 3 Routing Configuration Guide (672 pages)
- FastIron Ethernet Switch IP Multicast Configuration Guide (230 pages)
- FastIron SX, FCX, and ICX Diagnostic Reference (222 pages)
- ICX 7750 Hardware Installation Guide (80 pages)
- Network OS YANG Reference Manual v4.1.1 (238 pages)
- Network OS Software Licensing Guide v4.1.0 (34 pages)
- Network OS NETCONF Operations Guide v4.1.1 (622 pages)
- Network OS Message Reference v4.1.1 (478 pages)
- Network OS Feature and RFC Support Matrix (16 pages)
- Network OS Command Reference v4.1.0 (1418 pages)
- Network OS Administrator’s Guide v4.1.1 (748 pages)
- Mid-Mount Rack Kit (Switch) Installation Procedure (Supporting 300, 5100, 5300, 6505, 6510, 6520, 7800, 8000, VA-40FC, VDX 6710-54, and VDX 6740) (10 pages)
- Flush Mount Rack Kit Installation Procedure (Supporting VDX 6710-54, VDX 6720-24, VDX 6720-60, VDX 6730-32, VDX 6730-76, and VDX 6740) (10 pages)
- VDX 6710-54 QuickStart Guide (12 pages)
- VDX 6710-54 Hardware Reference Manual (72 pages)
- VDX 6730 Hardware Reference Manual (Supporting VDX 6730-32 and VDX 6730-76) (90 pages)
- VDX 6730 QuickStart Guide (Supporting VDX 6730-32 and VDX 6730-76) (12 pages)
- Fixed Rack Mount Kit Installation Procedure (Supporting 300, 5100, 5300, 6520, 7800, 8000) (12 pages)
- VDX 8770-8 Two-Post Flush and Mid-Mount Rack Kit Installation Procedure (8 pages)
- VDX 8770-8 QuickStart Guide (34 pages)
- VDX 8770-8 Hardware Reference Manual (136 pages)
- VDX 8770-8 Four-Post Flush and Recessed Mount Rack Kit Installation Procedure (10 pages)
- VDX 8770-4 Two-Post Flush and Mid-Mount Rack Kit Installation Procedure (10 pages)
- VDX 8770-4 QuickStart Guide (32 pages)
- VDX 8770-4 Hardware Reference Manual (132 pages)
- VDX 8770-4 Four-Post Flush Mount Rack Kit Installation Procedure (8 pages)
- VDX 8770-4 Four-Post Flush and Recessed Mount Intake Air Duct Rack Kit Installation Procedure (24 pages)
- VDX 6740 Hardware Reference Manual (Supporting VDX 6740, VDX 6740T, and VDX 6740T-1G) (78 pages)
- Universal Four Post Rack Kit Installation Procedure (Supporting VDX 6740T) (20 pages)
- Universal Two-Post Rack Kit Installation Procedure (Supporting VDX 6740T) (12 pages)
- FCX Series Hardware Installation Guide (112 pages)
- 6910 Ethernet Access Switch MIB Reference (102 pages)
- 6910 Ethernet Access Switch Hardware Installation Guide (84 pages)
- 6910 Ethernet Access Switch Diagnostic Guide (Supporting R2.2.0.0) (88 pages)
- 6910 Ethernet Access Switch Configuration Guide (Supporting R2.2.0.0) (1240 pages)
- Unified IP MIB Reference (Supporting Multi-Service IronWare Release 05.6.00a) (771 pages)