Chapter 10 – bar graphs and meters, Creating bar graphs – Maple Systems 5000HD Series User Manual
Page 167
EZwarePlus Programming Manual
161
1010-1015, Rev. 03
Chapter 10 – Bar Graphs and Meters
This chapter focuses on two special graphic objects, which can be used to display PLC data registers. You’ve learned
how to use shapes and bitmaps to represent the data in PLC registers as states. You’ve also learned how to use
alphanumeric data fields to display the contents of PLC registers as either numbers or ASCII characters. We now
introduce two more options to display the data in PLC registers: Bar Graphs and Meter Display. In Chapter 11 we will
introduce the Trend Display, another method of displaying data in PLC registers.
Creating Bar Graphs
The Bar Graph Object is used to represent the data in a 16-bit or 32-bit PLC register as a bar graph. You can configure
the bar graph to move up, down, right, or left. The bar graph can be configured with any base number that represents
0 level and any span range. You can create the bar graph with an alarm low and high setting to indicate to the HMI
operator that an underflow/overflow alarm condition exists. In addition, you can set the alarm low and high limits to
be controlled by two additional PLC registers so that the low and high limits are variable. Bar graphs can even be
constructed with a shape or bitmap overlaying the bar graph to create flow tanks, temperature gauges, etc.
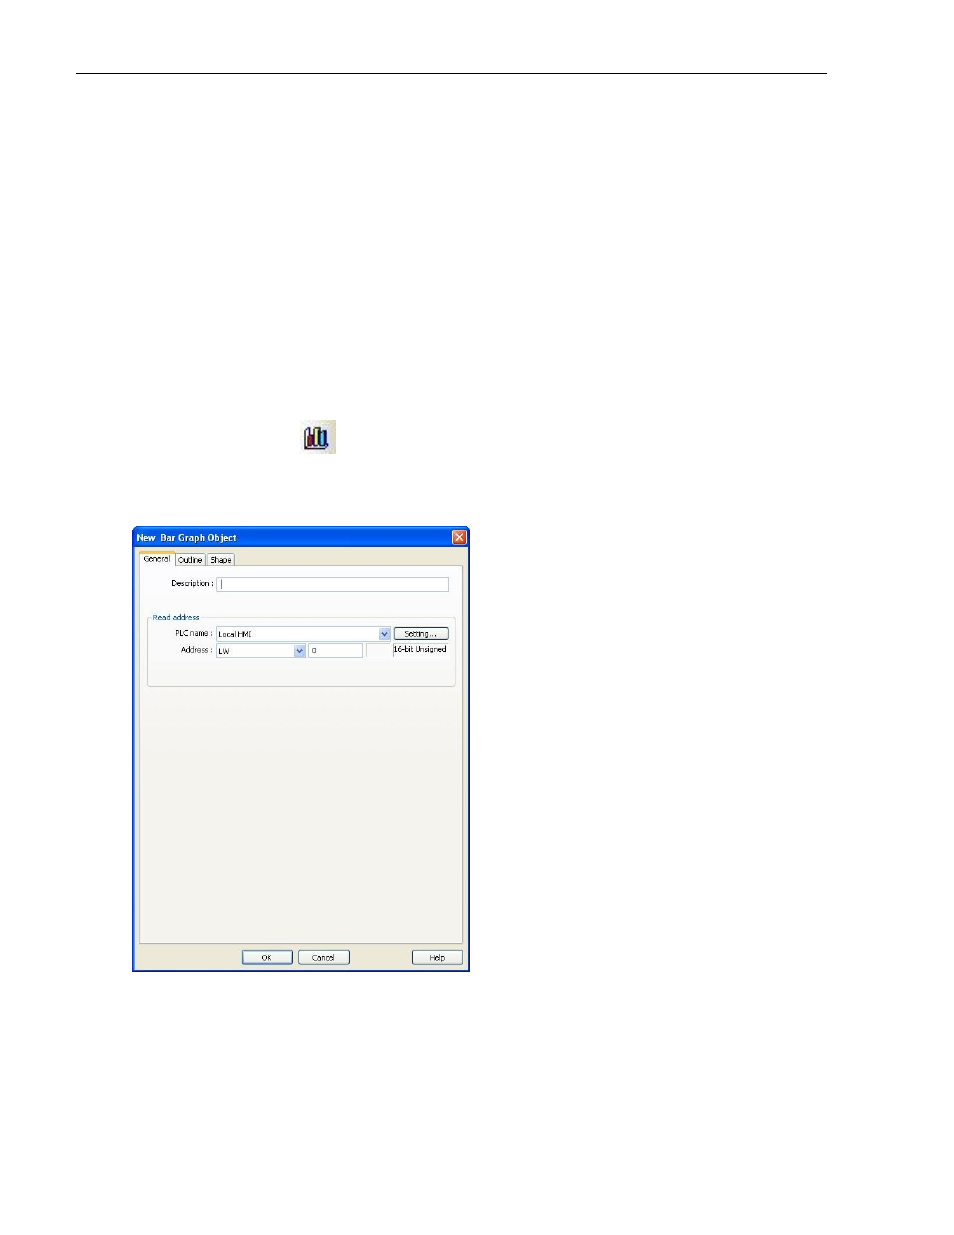
To create a Bar Graph Object:
1. From the Objects menu, click Bar Graph, or click the Bar Graph icon in the Object 2 toolbar. The New Bar
Graph Object dialog box appears.
2. Use the Description: box to enter a title for the Bar Graph object. A description is not necessary but does
help you identify the purpose of the part.
3. Click the Setting… button in the Read address frame. Select the device type from the drop down menu, and
then indicate the PLC register address. Select the data format.
4. Click on the Outline tab to display the outline form.