1 wan traffic – PLANET CS-2001 User Manual
Page 819
808
31.1 WAN Traffic
Step 1. In Monitoring > Traffic Grapher > WAN Traffic, it shows the statistics of
upstream / downstream packets over the WAN interface. The statistic charts
are available in the time unit of minute, hour, day, week, month and year.
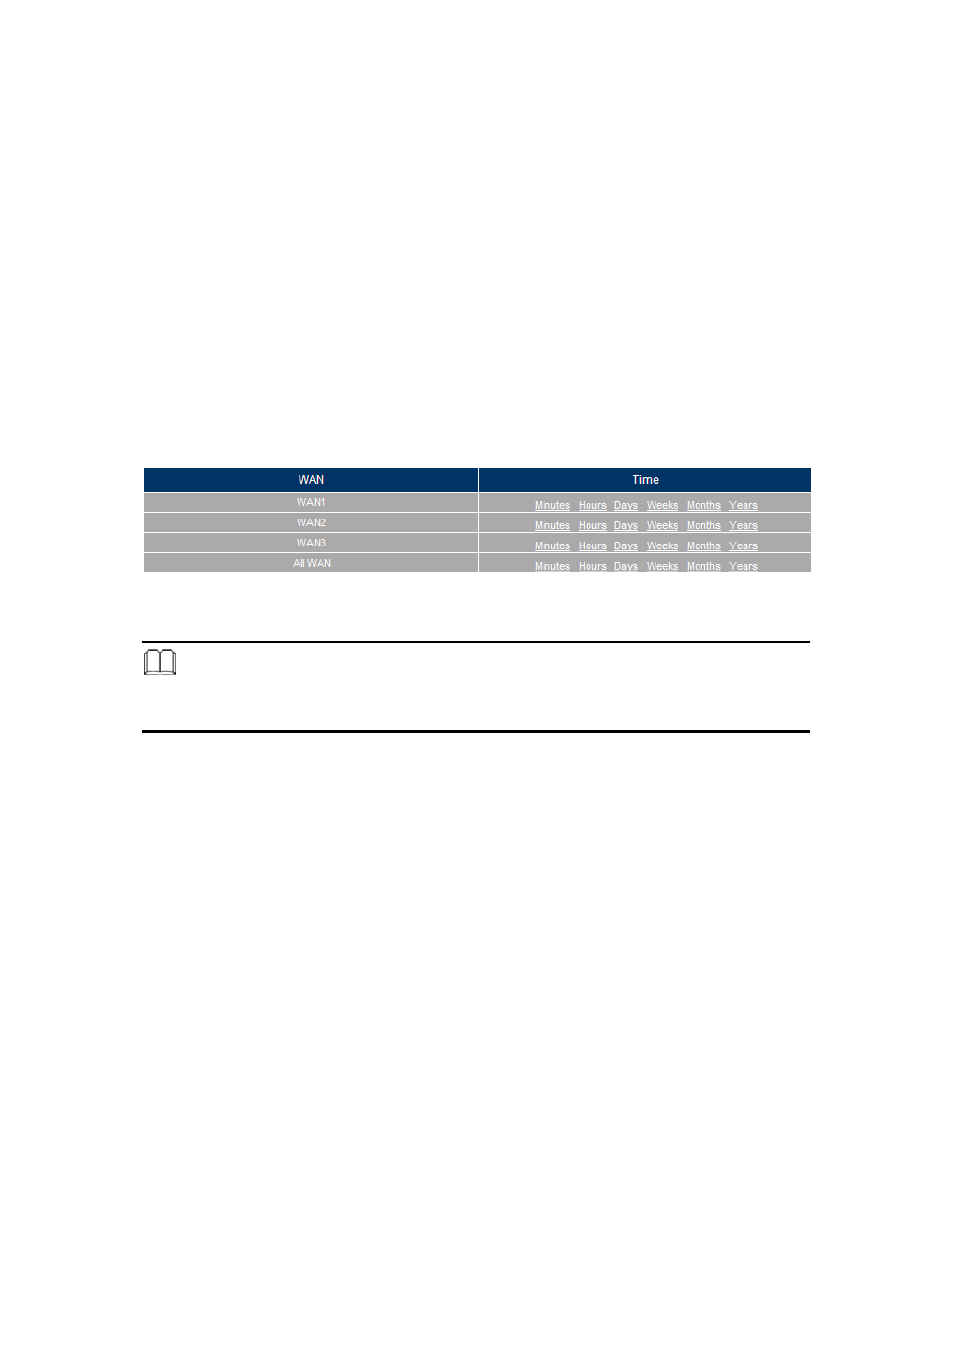
Click Minutes for statistic charts in the time unit of minute;Click Hours
for statistic charts in the time unit of hour;Click Days for statistic charts in
the time unit of day;Click Weeks for statistic charts in the time unit of
week;Click Months for statistic charts in the time unit of month;Click
Years for statistic charts in the time unit of year.
(Figure 29-1)
Figure 29-1 Different Time Units for Statistics
Note:
1. The WAN statistics is a subordinate function of WAN interface. Thus, it is activated when
WAN interface is enabled.
- ISW-1022M (167 pages)
- ADE-2400A (8 pages)
- ADE-4400 (2 pages)
- ADE-3400 (2 pages)
- ADE-3400 (61 pages)
- ADE-3400 (73 pages)
- ADW-4401 (84 pages)
- ADE-4400 (2 pages)
- ADE-3100 (51 pages)
- ADE-3410 (2 pages)
- ADW-4401 (2 pages)
- ADW-4401 (2 pages)
- ADN-4000 (2 pages)
- ADN-4000 (118 pages)
- ADN-4000 (91 pages)
- ADN-4100 (115 pages)
- ADN-4100 (2 pages)
- ADN-4100 (2 pages)
- ADN-4100 (2 pages)
- ADN-4100 (104 pages)
- ADN-4102 (2 pages)
- ADU-2110A (2 pages)
- ADU-2110A (37 pages)
- ADW-4302 (8 pages)
- ADW-4302 (6 pages)
- ADW-4100 (57 pages)
- GRT-501 (52 pages)
- GRT-501 (51 pages)
- PRT-301W (32 pages)
- VC-100M (26 pages)
- CS-2000 (13 pages)
- CS-2000 (573 pages)
- CS-2000 (16 pages)
- BM-525 (205 pages)
- CS-1000 (226 pages)
- BM-2101 (278 pages)
- CS-2001 (16 pages)
- CS-500 (12 pages)
- CS-5800 (12 pages)
- SG-4800 (182 pages)
- FRT-401NS15 (12 pages)
- FRT-401NS15 (76 pages)
- FRT-405N (2 pages)
- FRT-405N (108 pages)