Dr. Livingstone, I Presume WELDWISE 2400 User Manual
Page 49
0433-INS-400
Rev.
E
6-3
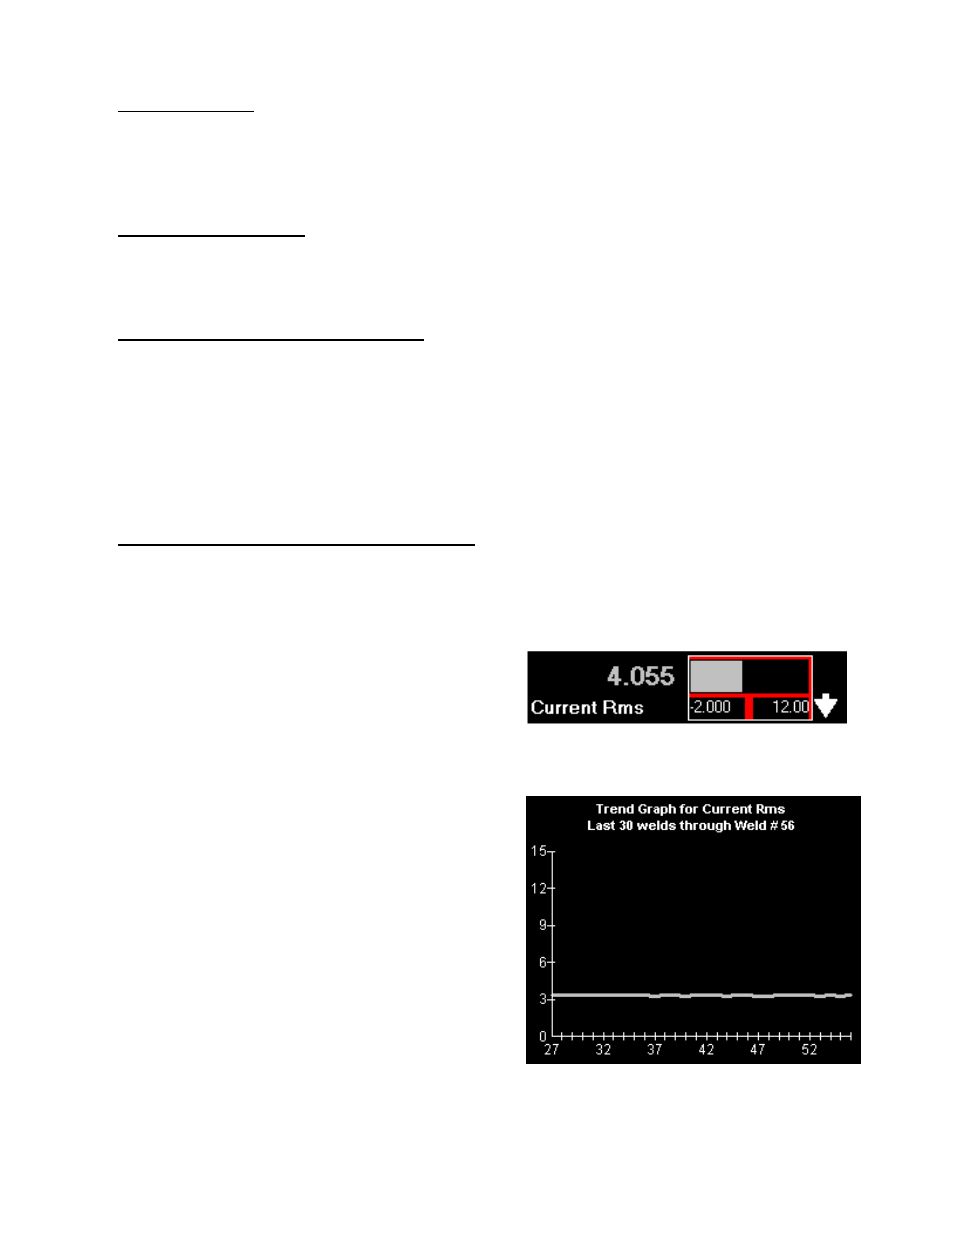
• Parameter Value
The most recent weld summary data for the selected parameter is displayed. The units displayed
may be changed in the Tolerance Defaults screen. In figure 6-3, the weld summary data for
Current Rms is displayed in KA.
• Graph Low/High Limit
Each parameter has its own graph limit settings. These can be specified in the Graph Setup option
of the Setup Menu. In figure 6-3, the Graph Low limit is –2 and the Graph High limit is 12.
• Parameter High/Low Limit Indicators
These are displayed if the current weld’s parameters are not within the master tolerance limits. The
top arrow will flash if a value exceeded its high limit; the bottom arrow will flash if a value is
below its low limit. If the value for that parameter is within tolerances, no indicator is displayed.
Note: I
f a parameter was out of tolerance but is not shown in one of the parameter displays, the
Weld Status high/low indicators will flash. In this situation, you can scroll through the parameters
or use the Weld Summary to determine why a weld has failed.
• Bar Graph and Trend Graph Display button
This field shows the parameter value as a bar graph between the high and low graph limits.
Note:
If the data value falls outside the graph limits, the bar will not be visible. Graph limits may
be changed using the Graph Setup option of the Setup menu.
The bar graph also serves as a button to display a
trend graph for the selected parameter. Touch (on
touch screen), or navigate to the bar graph and use
SELECT. A trend graph of the last 30 welds is
displayed. The weld number is displayed on the x-
axis (horizontal) and the data parameter value is
displayed on the y-axis (vertical). To return to the
Main Screen, use the ESCAPE button.
Figure 6-5 Example of a Trend Graph for
Current Rms.
Figure 6-4 Touch (touch screen) on the
parameter bar graph to display a Trend Graph
for that parameter