Field calibration – Rockwell Automation 1441-PEN25-Z Enpac 2500 Data Collector User Manual
Page 297
Rockwell Automation Publication GMSI10-UM002D-EN-E - August 2012
297
FRF Frequency Response Function Extension Module
Chapter 11
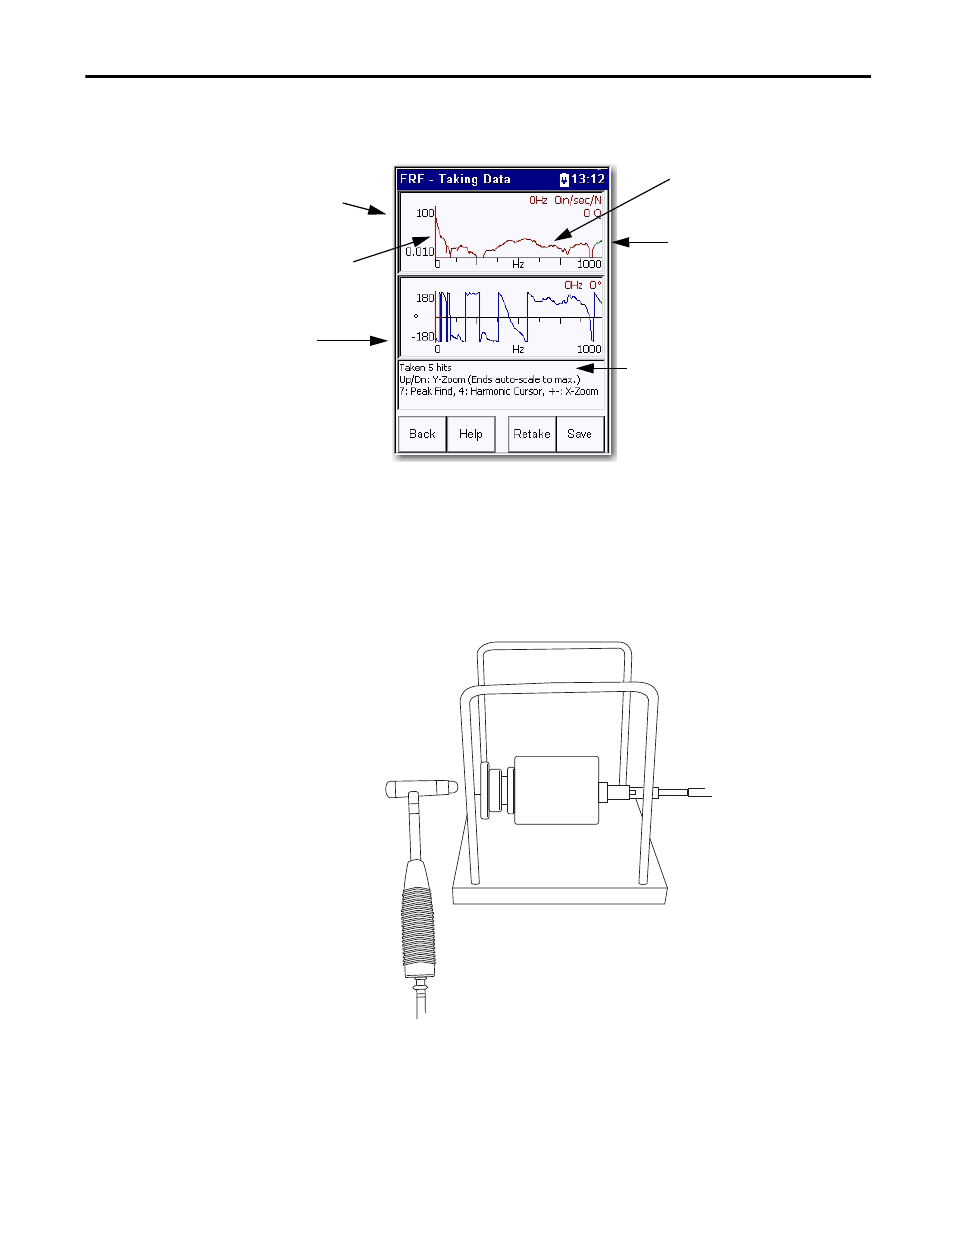
The FRF - Taking Data screen shows frequency, magnitude, phase, and Q
factor (where appropriate) at the cursor position.
Field Calibration
Data can be checked for calibration and integrity by carrying out a test on a
known mass, for example, a calibration weight or steel bar of a measured value.
Use a calibration weight of 1kg or any other known mass.
Figure 37 - Field Calibration Setup
This is an example of a set-up for Field Calibration.
1.
Fit the correct tip to the modally tuned hammer.
2.
Connect the hammer to CH1.
Indicates how many hits were
taken.
FRF Measurement
The FRF is colored red where
coherence falls below 80%.
Good coherence shows the trace
in green.
Phase
Coherence for the measurement,
represented by the color of the
FRF trace.
32160-M