Saving run up/coast down measurements, File – Rockwell Automation 1441-PEN25-Z Enpac 2500 Data Collector User Manual
Page 279
Rockwell Automation Publication GMSI10-UM002D-EN-E - August 2012
279
Run Up/Coast Down Application
Chapter 10
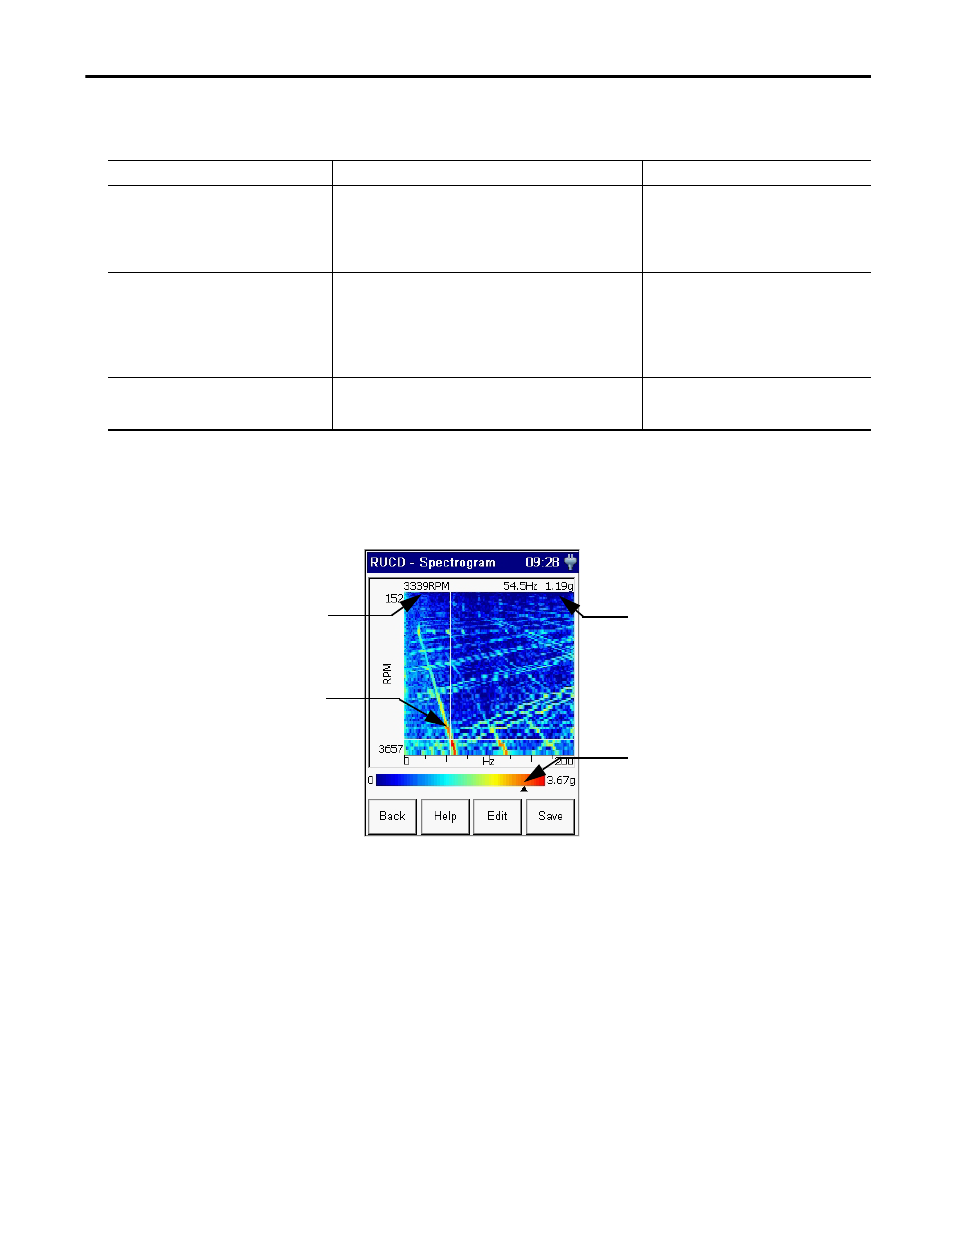
Viewing the Spectrogram Plot
After setting up the Spectrogram spectra, press F4 (Display) on the Spectrogram
Display Setup screen.
The Spectrogram plot uses color to indicate the amplitude of the signals. Red
means a higher amplitude and blue means a lower amplitude.
Use the UP and DOWN ARROW keys to sequence through the displayed
spectra. Use the LEFT and RIGHT ARROW keys to move the cursor on the
active spectrum.
Saving Run Up/Coast Down
Measurements
The Run Up/Coast Down setup parameters and measurements can be saved to a
file which can then be recalled at a later time. The collected data is saved in the
form of a time waveform (.wav file).
Table 52 - Spectrogram Plot Setup Parameters
Parameter Name
Description
Values/Comments
Y-axis
Sets the Y-axis scaling on the spectrogram plot.
• Linear - The plot grid centers are linearly spaced in Y between the
centers of the first and last grid.
• Log - The plot grid centers are logarithmically spaced in Y between
the centers of the first and last grid.
Options:
Linear
Log
Z-axis
Controls the spacing between the collected spectra.
• RPM- FFTs spaced depending on the RPM at which they were
recorded.
• Timestamp- FFTs spaced depending on the time the data was
recorded.
• Even Spacing- FFTs spaced evenly along the Z-axis.
Options:
RPM
Timestamp
Even Spacing
Blanking
Eliminates the display of data below a certain level on the Y-axis. This
setting helps clarify the presence of machine orders or structural
frequencies.
0%…25%
Frequency and Magnitude at the Cursor
Position
Speed
Cursor
Amplitude Indicator at Cursor
Position
TIP
Press the P key to quickly move the cursor to the next significant peak.