Displaying the waterfall plot – Rockwell Automation 1441-PEN25-Z Enpac 2500 Data Collector User Manual
Page 273
Rockwell Automation Publication GMSI10-UM002D-EN-E - August 2012
273
Run Up/Coast Down Application
Chapter 10
Displaying the Waterfall Plot
When you are finished setting up the plot parameters, you can process the
spectral data by pressing F4 (Display) on the RUCD - Waterfall Setup screen.
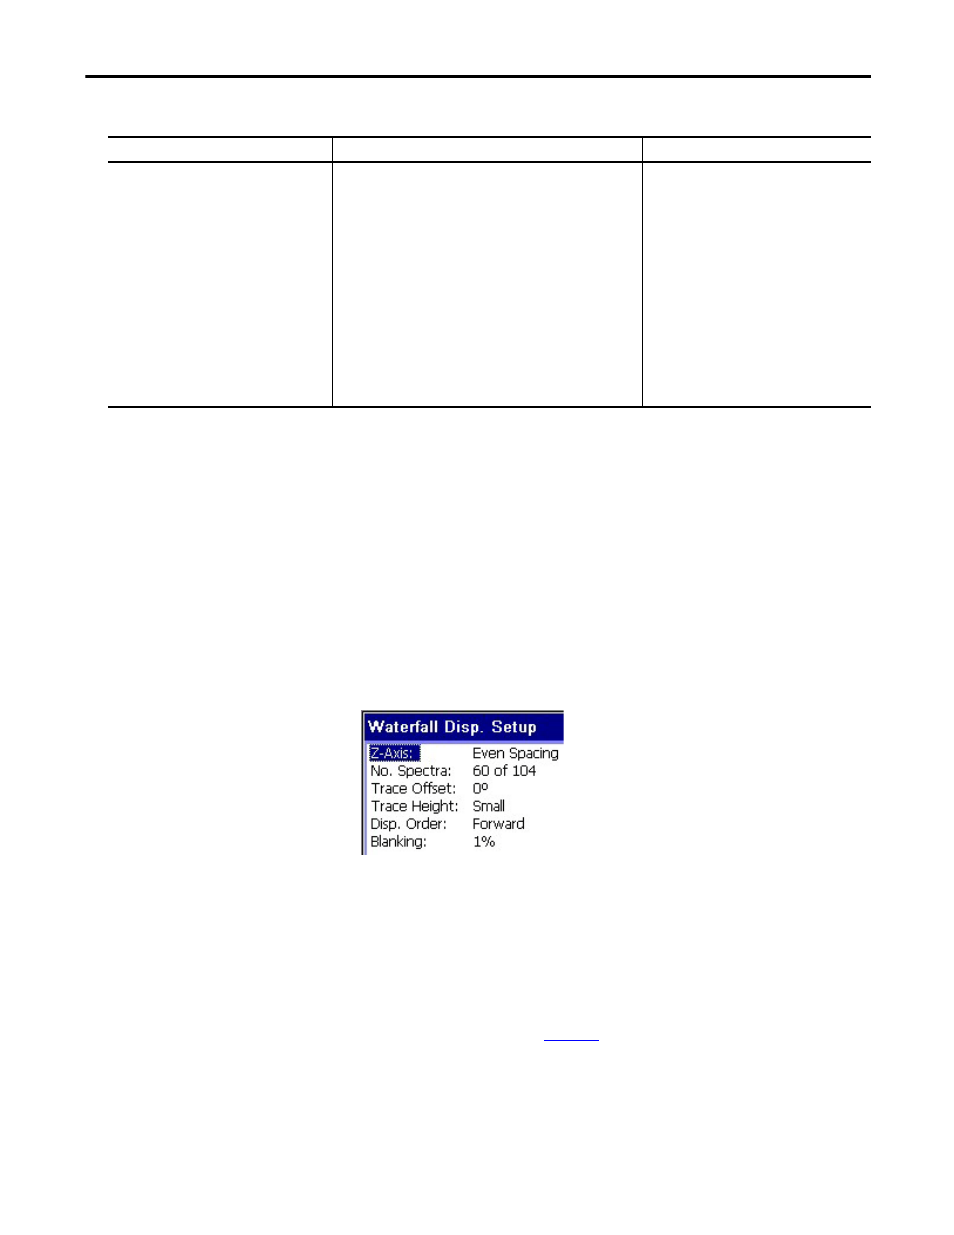
Optimizing the Waterfall Plot
Additional parameters display on the screen by allowing you to control how the
spectra appear in the waterfall plot.
1.
Highlight the option and press the RIGHT ARROW key to open a menu
of choices.
2.
Select the choice by pressing the arrow keys or type in a value using the
numeric keypad.
3.
Press the LEFT ARROW key to save your selection.
Use the descriptions in
Table 50
to help you configure the parameters.
LF Cutoff (EU)
Sets a low frequency cutoff filter to remove noise from the analysis.
Options:
Off
21.6 CPM
66 CPM
120 CPM
600 CPM
4200 CPM
.36 Hz
1.1 Hz
2 Hz
10 Hz
70 Hz
The available options are determined by the X-axis
selection.
Table 49 - Waterfall Plot Parameters
Parameter Name
Description
Values/Comments
TIP
The larger the .wav file, the longer it takes to
process the data and display the plot.