Displaying the bode plot – Rockwell Automation 1441-PEN25-Z Enpac 2500 Data Collector User Manual
Page 264
264
Rockwell Automation Publication GMSI10-UM002D-EN-E - August 2012
Chapter 10
Run Up/Coast Down Application
Displaying the Bode Plot
When you are done setting up the Bode plot parameters, you can process the data
and display the Bode plot by pressing F4 (Display) on the RUCD - Bode Setup
screen.
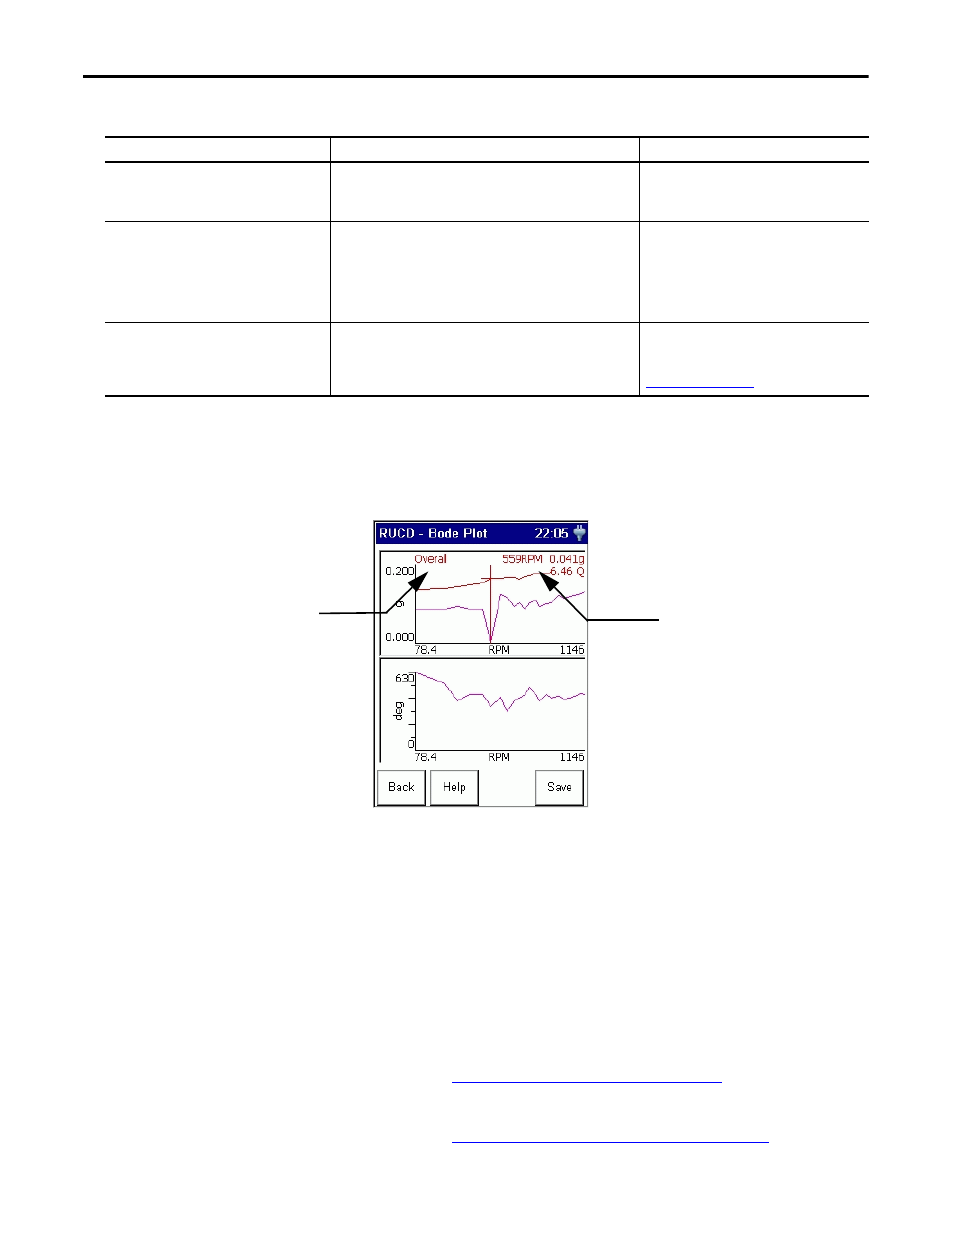
The top of the display shows magnitude versus RPM. The bottom of the display
shows phase versus RPM.
To sequence through the traces, press the UP and DOWN ARROW keys. The
order number of the current trace is displayed in the top left corner of the screen.
To move the cursor along the trace, press the LEFT and RIGHT ARROW keys.
From the Bode plot you can also display the data in a Table format or Nyquist
plot. To display the data in a table, press the 0 (Shift) key and F4 (Table)
simultaneously.
Refer to Displaying the Table on page 270
To display the data in a Nyquist plot, press the 0 (Shift) key and F1 (Nyqst)
simultaneously.
Refer to Displaying the Nyquist Plot on page 267
Show Overall
Determines whether to display the overall severity as a trace on the
Bode plot.
Options:
Yes
No
Num Traces
Sets the number of traces or order tracks to be displayed on the Bode
plot.
The number of traces available is determined by the Show Overall
parameter.
Your selection determines the available number of Trace Order
parameters.
Options:
1
2
3
4
Trace Order #1-#4
The order numbers to be tracked and displayed on the Bode plot.
Enter a value from .001…166 orders
This value cannot exceed the Max No Orders value
set in the RUCD Setup screen.
See Table 44 on page 258
.
Table 46 - Bode Plot Parameters
Parameter Name
Description
Values/Comments
Speed, magnitude, and Q factor at
cursor location
Active trace
TIP
The larger the .wav file, the longer it takes to process
the data and display the plot.