Detailed sample progress, Message log – Luminex 100 IS User Manual, Version 2.1 User Manual
Page 92
100 IS S Users Manual Version 2.1
x
MAP Technology
7 - 32
PN 89-00002-00-061 Rev. A
The system monitor provides values and units of measure for each
property. It uses the following units for the displayed values:
•
Air Pressure, PSI (used during sample acquisition, only)
•
Sheath Pressure, PSI
•
Delta Cal Temperature, ºC
•
Board Temperature, ºC
•
CL1 Temperature, ºC
•
CL2 Temperature, ºC
•
XYP Board Temperature, ºC
•
XYP Heater Temperature, ºC
•
XYP Heater In Range, Yes or No or N/A if the heater block is
not turned on
The system monitor provides information about the physical state of
the IS device, lasers, and acquisition.
The values in the system monitor are reported directly from the
Luminex 100 analyzer and the XYP instrument.
The system monitor also indicates whether CAL1, CAL2, CON1,
and CON2 results completed successfully or not by displaying the
text in green if the event is successful and in red text if the event is
unsuccessful.
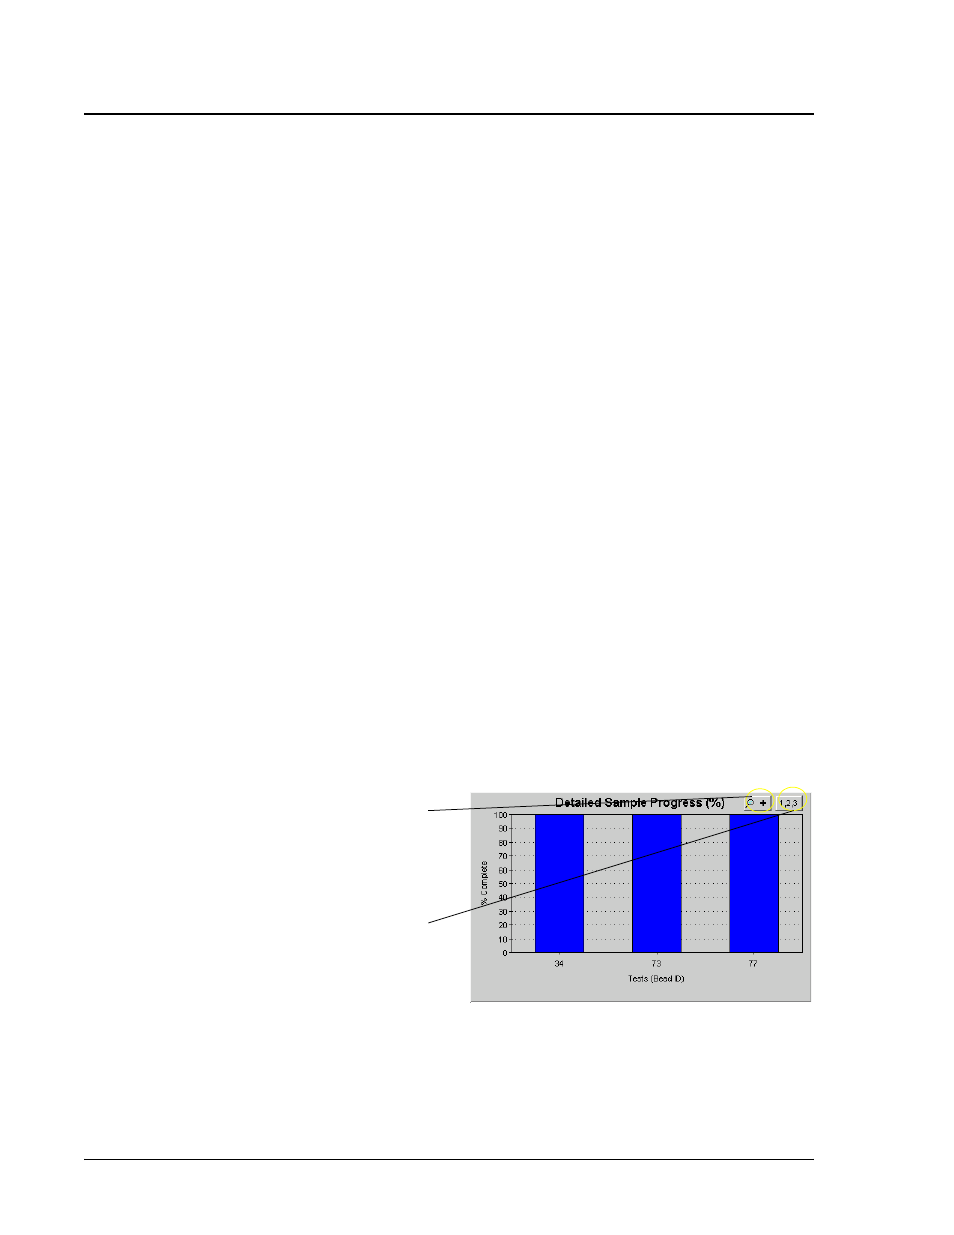
Detailed Sample Progress
The detailed sample progress shows you, in chart form, how much of
each operation has elapsed. The chart shows real-time progress, so
that as each sample is analyzed, the chart adjusts to show progress.
Figure 52. Detailed Sample Progress
Message Log
The software shows you a list of completed commands as well as
errors and warnings in the message log on the lower part of the
diagnostics tab. The message log shows a history of past functions
Show no more
than 20 tests at a
time. A scroll bar
lets you shift the
test frame.
Toggle bead ID or
test name.