B&B Electronics VFG3000 - Manual User Manual
Page 113
C
ONFIGURING A
V
IRTUAL
HMI
P
RIMITIVE
D
ESCRIPTIONS
R
EVISION
1
P
AGE
97
•
The Data Points properties are used to define the pattern and colors used to
create the data point markers. These properties will only be accessible if the
chart has these data point markers enabled.
•
The Data Line properties are used to define the format and color of the line
drawn between the data points. These properties will only be accessible if the
chart has this line enabled.
•
The Regression Line properties are used to define the format and color of the line
drawn as a best-fit to the data points. These properties will only be accessible if
the chart has this line enabled.
T
HE
S
CALE
P
RIMITIVES
The Horizontal Scale primitive displays a scale with a specified number of minor
and major divisions. It is often used to label other primitives, such as bar graphs.
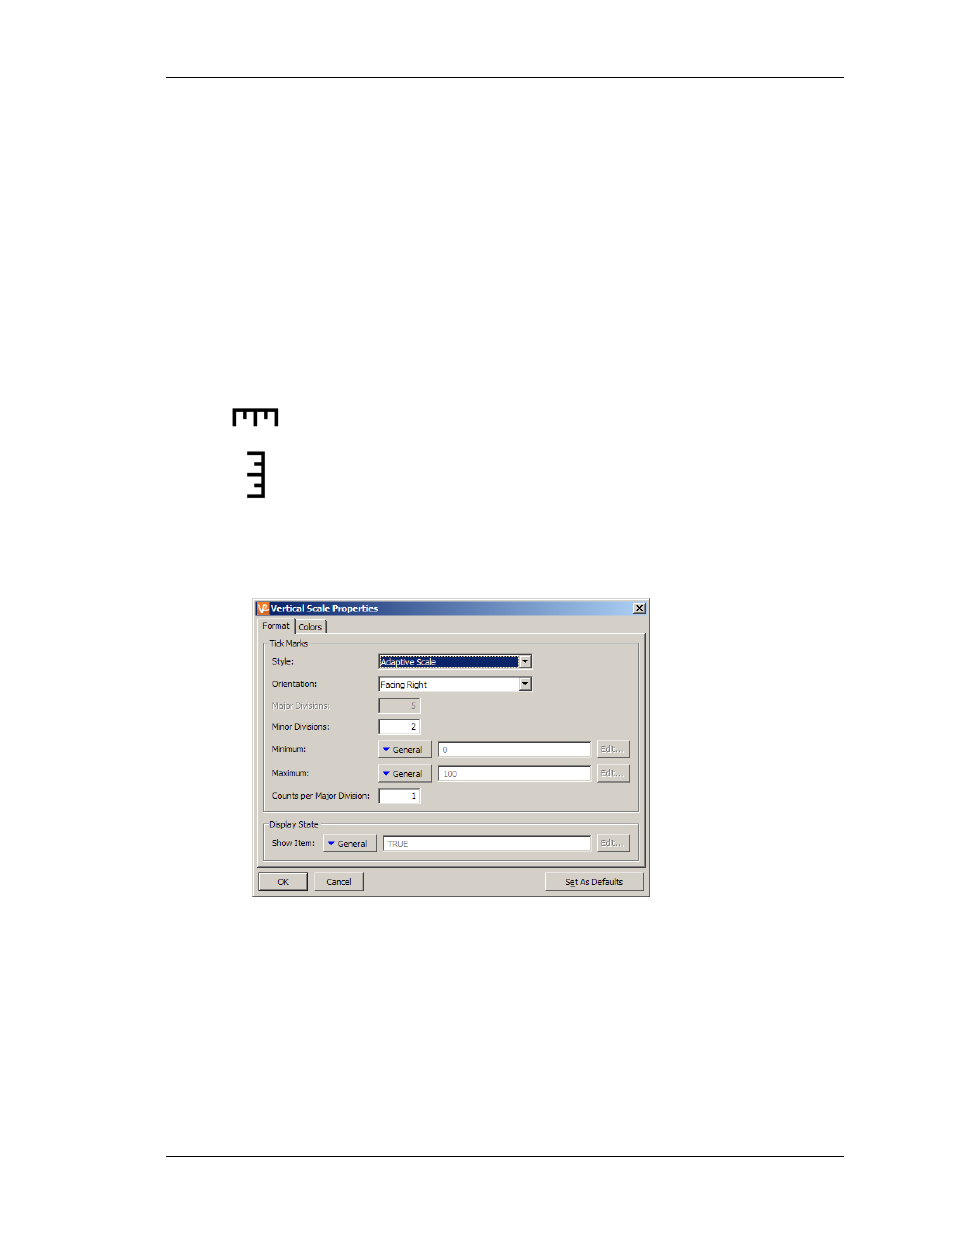
The Vertical Scale primitive displays a scale with a specified number of minor
and major divisions. It is often used to label other primitives, such as bar graphs.
The scale primitives can either be fix or adaptive, the latest providing a new set of division if
the maximum or minimum is changed. The properties are accessed by double-clicking the
primitive…
•
The Style property defines if the scale should be fixed or adaptive. If the second
is selected, the minimum and maximum are made available for tag mapping so
the scale follows tags values.
•
The Orientation property is used to indicate the direction in which the tick-marks
should point. Vertical scales support selections of left and right, while horizontal
scales support selections of up or down.
•
The Major Divisions property is used to indicate into how many major divisions
the scale should be divided. Large tick-marks are drawn at each division. The