INFICON Cygnus 2 Thin Film Deposition Controller User Manual
Page 260
14 - 12
IP
N 07
4-
54
5-
P1
E
Cygnus 2 Operating Manual
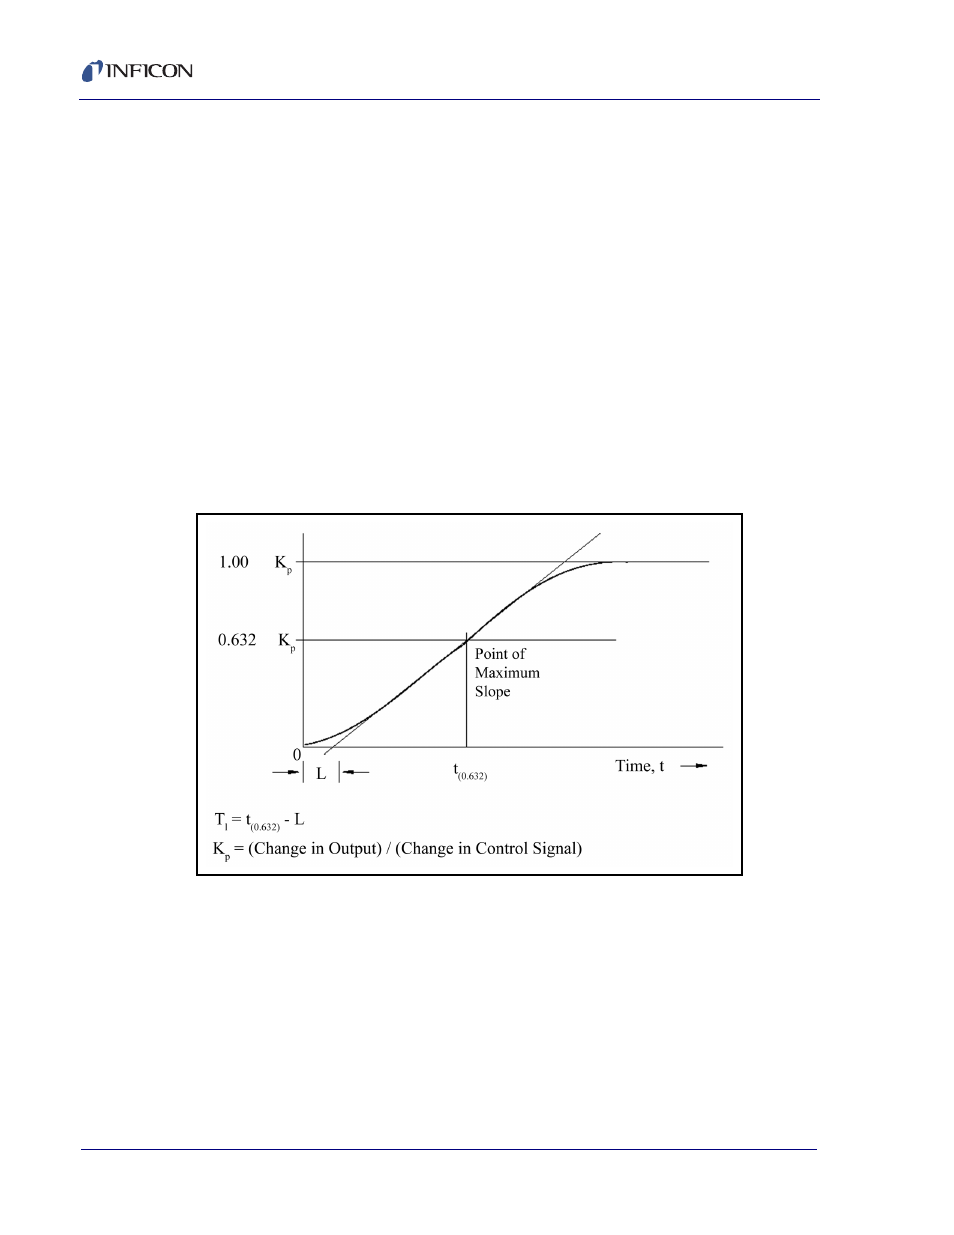
In general, it is not possible to characterize all processes exactly; some
approximation must be applied. The most common is to assume that the dynamic
characteristics of the process can be represented by a first-order lag plus a dead
time. The Laplace transform for this model (conversion to the s domain) is
approximated as:
[8]
Three parameters are determined from the process reaction curve. They are the
steady state gain, K
p
, the dead time, L, and the time constant, T
1
. Several methods
have been proposed to extract the required parameters from the system response
as graphed in
. These are: a one point fit at 63.2% of the transition (one
time constant); a two point exponential fit; and a weighted least-square-exponential
fit. From the above information a process is sufficiently characterized so that a
controller algorithm may be customized.
Figure 14-7 Response of process to an open loop step change
(At t=0 control signal is increased)
A controller model used extensively is the PID type, shown in Laplace form in
[9]
Where
M(s) = manipulated variable or power
K
c
= controller gain (the proportional term)
Output
Input
------------------
K
p
L
– s
exp
T
1
s 1
+
-------------------------------
=
M s
K
c
1
1
T
i
s
------- T
d
s
+
+
Es
=