Understand row details for system offender – HP Neoview Release 2.5 Software User Manual
Page 199

Description
Field or Option
The process that spawned the children processes described in the Detail tab.
Parent Process
Controls which processes are displayed in the Detail tab based on CPU utilization.
Set this value to the lowest CPU utilization that you want the dialog box to display.
For example, if you set the CPU Value to 0, the tabs display all children processes in
all CPUs. If you set the CPU Value to 50, the tabs display all children processes running
in CPUs that are utilized at 50% or greater.
Filter CPU Value
Updates the information in the Summary Table and Detail tabs.
[ Refresh ]
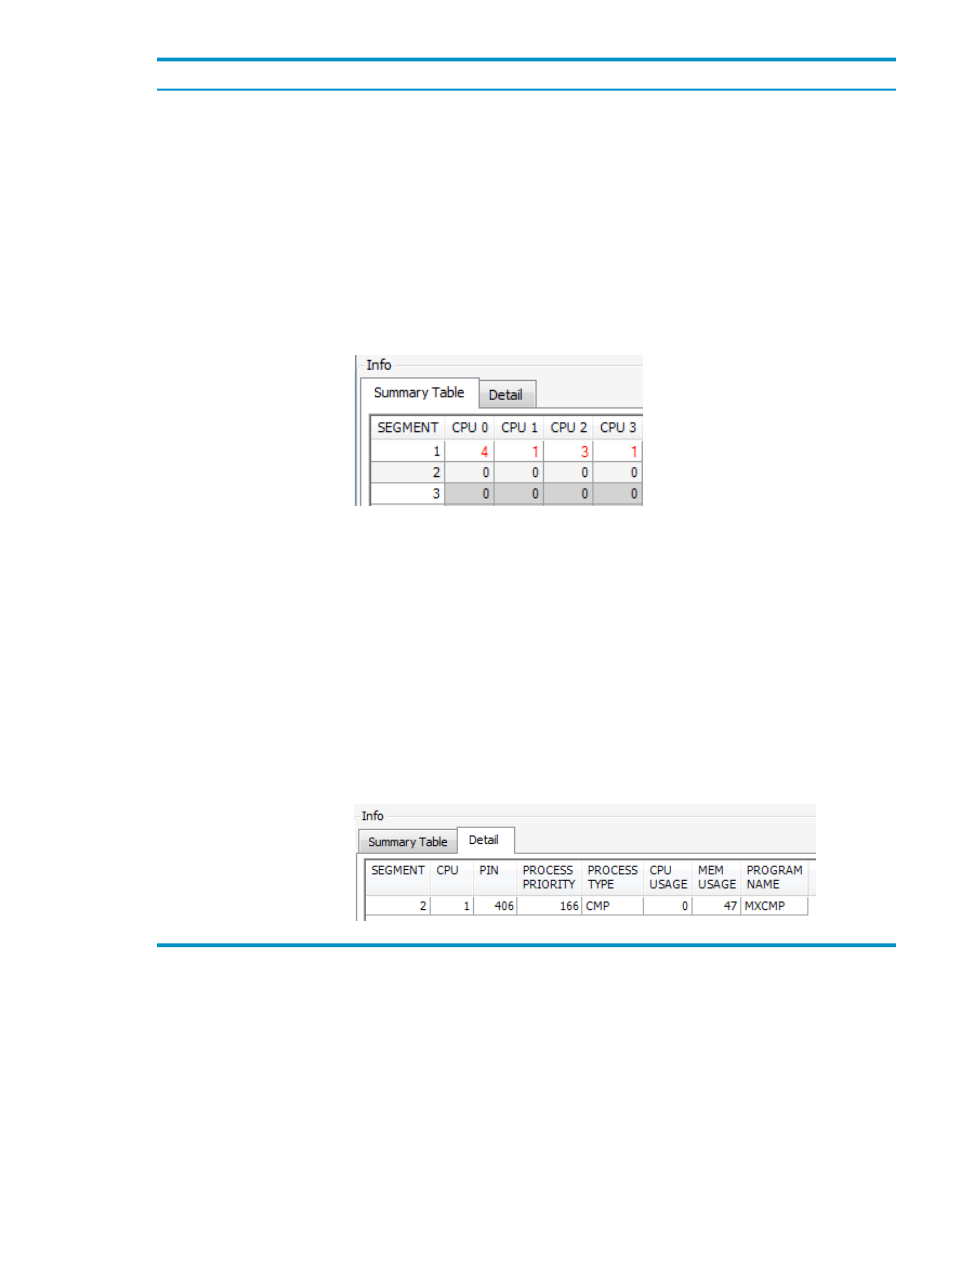
Displays the number of children processes running in each CPU for all segments of
a Neoview platform. Gray cells indicate CPUs or segments that are not available. A
blue number indicates that the CPU utilization is less than 90%. A red number indicates
that the CPU utilization is greater than or equal to 90%. For example, this Summary
Table
tab shows segment 1 CPUs 0, 1, 2, and 3 running at 90% or above:
Summary Table Tab
Displays detailed information about all children processes for the selected parent
process. The information includes:
•
SEGMENT
•
CPU
•
PIN
•
PROCESS PRIORITY
•
PROCESS TYPE
•
CPU USAGE
•
MEM USAGE
•
PROGRAM NAME
In the CPU USAGE column, a red number indicates CPU utilization of greater than
or equal to 90%. A blue number indicates CPU utilization of less than 90%. This
example shows zero CPU usage, so the number is displayed in black:
Detail Tab
Related Topics
“Get Children Process Information” (page 198)
Understand Row Details for System Offender
This table describes row detail information for the System Offender data grid. For more
information about displaying row details, see
“Get Row Details for a Data Grid” (page 49)
.
Understand Row Details for System Offender
199
