HP Neoview Release 2.5 Software User Manual
Page 177

This table describes the system monitor options and settings:
Description
Option or Setting
This option shows the Port Number for connecting to the Neoview platform. The
default number is 4746, which should satisfy most installations. If the system monitor
fails to return data and you suspect that a different port was assigned, contact your
HP support representative.
The Fixed Incoming option is provided for troubleshooting at sites where the client
workstation is behind a firewall. Selecting this option activates a “client port” that
you can specify. The default client port number is 0 (Windows reads 0 as a placeholder
for the next available outgoing port).
The Fixed Incoming option is useful because the System Monitor both receives and
sends data to the Neoview platform. The System Monitor uses a dynamic port for
incoming communications, which means it doesn't know the incoming port number
until a connection is made. This requires opening a firewall to a large range of ports,
which can be undesirable. To avoid opening up a large number of ports, you can
specify a fixed incoming port using this option.
Port
The refresh rate is the amount of time that the client waits before requesting new data
from the server. The default rate is 2 seconds. You can change the refresh rate to
another value in the range 2 through 500 seconds.
NOTE:
The server does not always return the requested data immediately. For
instance, if the refresh rate is set to 5 seconds, the client requests data from the server
every 5 seconds. But the server can take an additional 2 to 4 seconds to respond with
the data. In this sense, the refresh rate is closer to an update request interval.
Refresh Rate Options
Options that allow you to show or hide these system status icons:
•
Connectivity
•
Transactions
•
Disks
•
Alerts
To hide an icon, deselect the appropriate option.
Active System Status Alerts
Controls where the system status icons appear. You can display the icons above or
below the bar graph or timeline information.
System Status Location
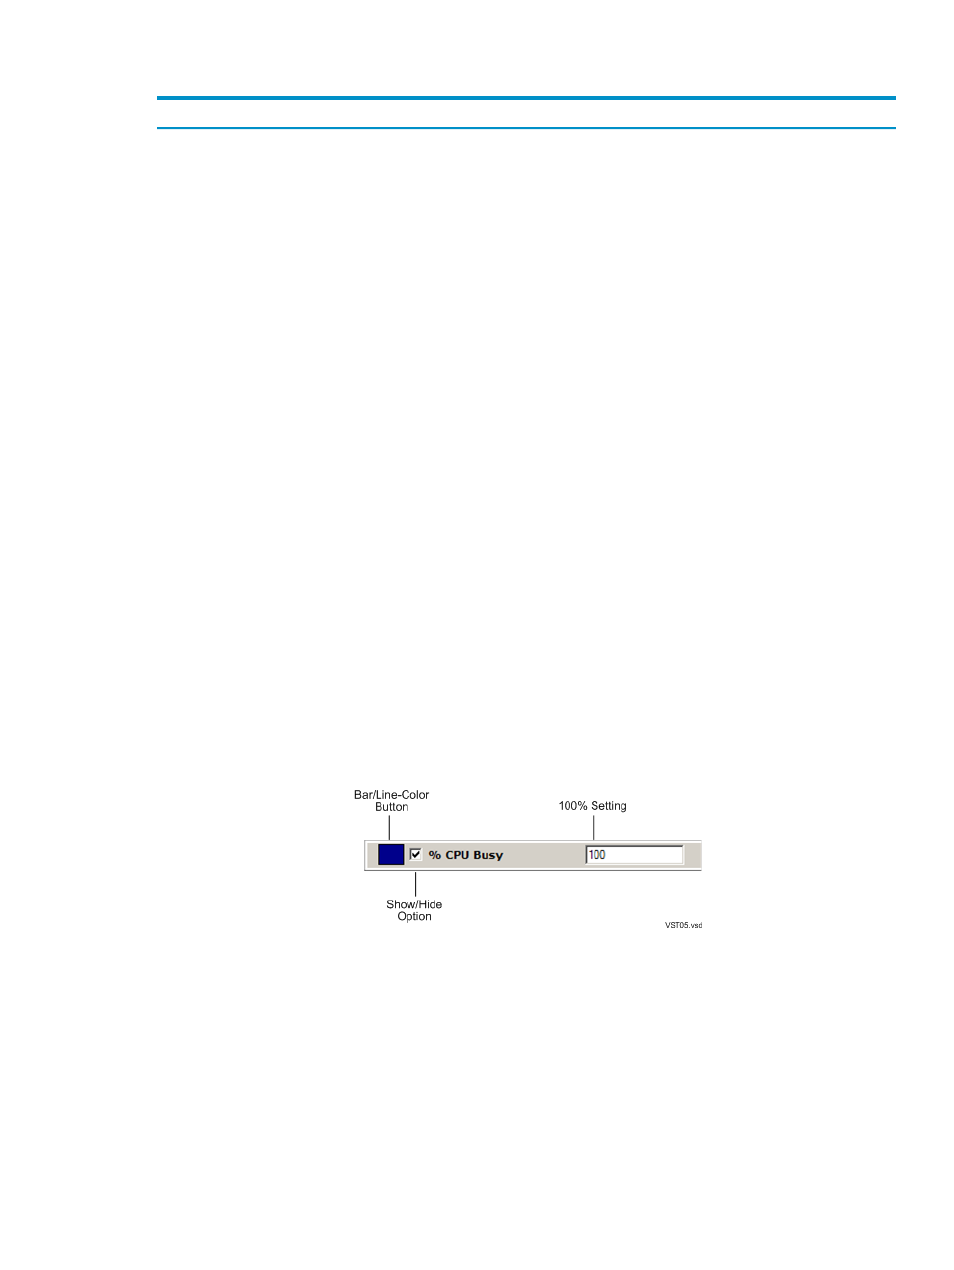
Control the bar/line color, show/hide option, and 100% setting for performance metrics.
For example:
•
The bar/line color is the color of the specified bar in the bar graph or the line in the
timeline. See
“Change a Color Option” (page 179)
•
The show/hide option controls whether or not the metric is displayed. When a
show/hide options is selected, the performance metric is displayed. When the
option is deselected, the metric is hidden.
•
The 100% setting is the highest non-error value that the system monitor is currently
configured to display. A value higher than the 100% value causes the bar color to
change. A value higher than the 100% setting is not reflected by the bar but is
captured in the tooltip information.
Metric and 100% Settings
Options that control the background colors for the timeline, bar graph, and the
lost-connection condition. The Lost Connection Background Color is implemented
only if the Timeout Color option is selected. See
“Change a Color Option” (page 179)
Chart Background Options
Configure System Monitor Options
177
