Use the system monitor with segment aggregation – HP Neoview Release 2.5 Software User Manual
Page 178

Description
Option or Setting
Options that control the bar color for the mouse-over, threshold-exceeded, and
CPU-down conditions. See
“Change a Color Option” (page 179)
Additional Color Options
Options that control the way data collected (aggregated) for each bar in the bar graph
(Bar Graph tab):
•
No Aggregation displays one bar per CPU (16 bars per segment). For example,
the client shows 64 bars (16 CPUs per segment) for a four-segment platform.
•
Segments displays one bar per segment. For example, the client shows four bars
for a four-segment platform. Each bar represents the average value for a given
metric for the segment. If a metric exceeds its 100% setting, the bar color changes
to the Threshold Exceeded bar color.
Special viewing features are available when segment aggregation is selected. See
“Use the System Monitor With Segment Aggregation” (page 178)
.
Aggregation Options
Controls the chart background color when the connection with the server is lost. If
this option is selected, the Lost Connection Background Color is implemented when
a connection is lost. The Lost Connection Background Color can help you recognize
when the data provided by the client is no longer valid. The System Monitor retries
the connection every couple of seconds for about 10 minutes. After 10 minutes, an
error message is displayed.
Timeout Color
Controls the Show Separators option. Segment separators are the vertical lines on
the system monitor screen that mark each segment in a Neoview platform. These lines
appear by default, but you can hide them by deselecting this option.
Additional Settings
To specify the amount of time captured by a timeline, enter a number in the Max
Range
field. The default value is 50. This is the number of data points (intervals) that
you want the timeline to display. Data points are collected approximately every 2
seconds. Therefore, specifying a Max Range of 50 intervals produces a timeline of
about 100 seconds.
Timeline Options
Terms
Use the System Monitor With Segment Aggregation
If segment aggregation is selected in the system monitor options pane, the display changes to
show only one bar per segment. For example, if your system has four segments, the system
monitor shows four colored bars for each metric. Each bar represents the average (arithmetic
mean) value for that segment.
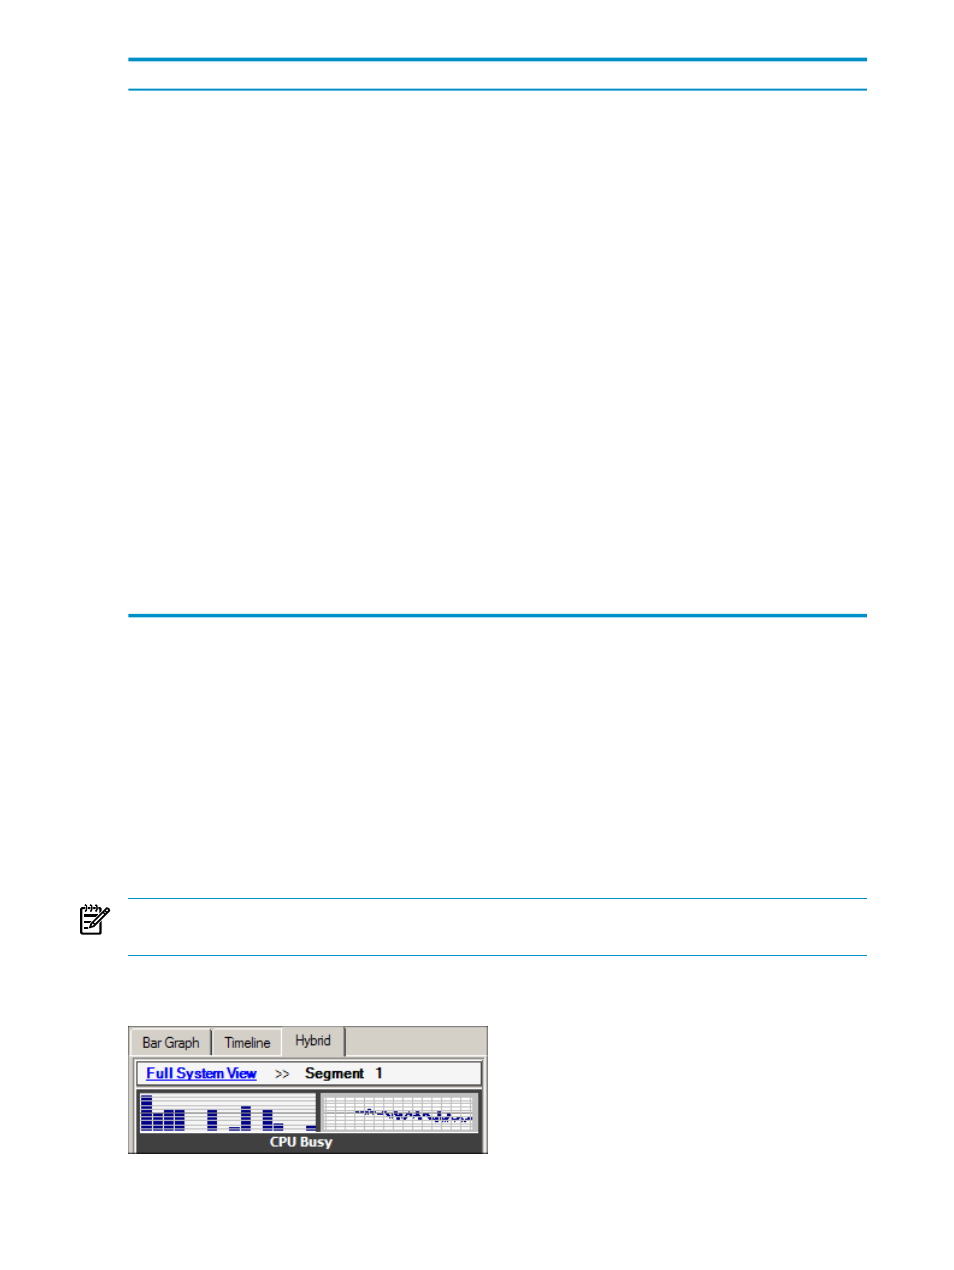
Clicking any of the segment bars in the bar graph area of the Bar Graph tab or Hybrid tab changes
the display to “drill down” on that segment. The display shows one bar for every CPU in the
selected segment.
NOTE:
When the display is focused on one segment, you can no longer view bar graph
information for any other segments.
To return to the full system aggregated view, click the Full System View link at the top of the
system monitor pane:
Related Topics
178
Use the System Monitor
