About the monitoring tab, View the over threshold summary – HP Neoview Release 2.5 Software User Manual
Page 246

Description
Pane
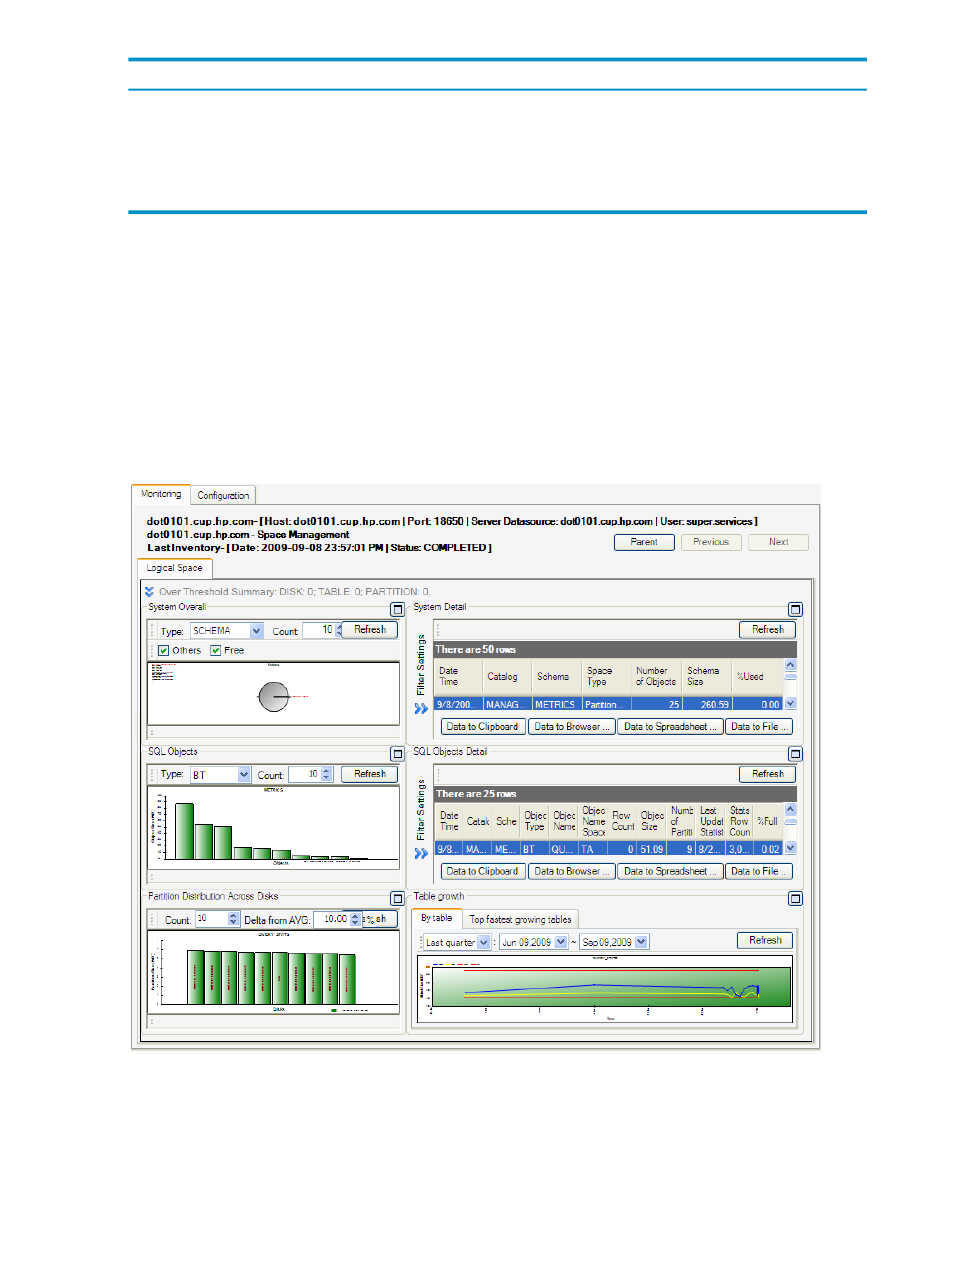
Detailed grid view of the SQL objects within the schema.
SQL Objects Detail
Bar graph view of the partition distribution across all disks in the system in megabytes (MB).
Partition
Distribution Across
Disks
Timeline view of the object sizes by table and the top fastest growing tables in the system.
Table Growth
Related Topics
“About the Monitoring Tab” (page 246)
About the Monitoring Tab
The Monitoring tab provides an SQL space snapshot of a selected Neoview system. A graphical
view visually depicts the system overall, including SQL objects, partition distribution across
disks, and table growth.
The Monitoring tab is the first point of reference for displaying SQL space management
information. The Monitoring tab shows multiple bar graphs, data grids, and a timeline that
represents a total view of the SQL space usage information for a selected system:
View the Over Threshold Summary
The Over Threshold Summary bar instantly allows you to identify if any disks, tables, or
partitions are reaching a specified threshold level. Only entries that meet threshold criteria are
displayed.
246
Manage Disk Space
- Scripting Toolkit for Linux (68 pages)
- Scripting Toolkit for Windows 9.50 (62 pages)
- Scripting Toolkit for Windows 9.60 (62 pages)
- Storage Area Manager (13 pages)
- Core HP-UX (5 pages)
- Matrix Operating Environment Software (232 pages)
- Matrix Operating Environment Software (70 pages)
- Matrix Operating Environment Software (120 pages)
- Matrix Operating Environment Software (36 pages)
- Matrix Operating Environment Software (192 pages)
- Matrix Operating Environment Software (99 pages)
- Matrix Operating Environment Software (198 pages)
- Matrix Operating Environment Software (66 pages)
- Matrix Operating Environment Software (95 pages)
- Matrix Operating Environment Software (152 pages)
- Matrix Operating Environment Software (264 pages)
- Matrix Operating Environment Software (137 pages)
- Matrix Operating Environment Software (138 pages)
- Matrix Operating Environment Software (97 pages)
- Matrix Operating Environment Software (33 pages)
- Matrix Operating Environment Software (142 pages)
- Matrix Operating Environment Software (189 pages)
- Matrix Operating Environment Software (58 pages)
- Matrix Operating Environment Software (68 pages)
- Matrix Operating Environment Software (79 pages)
- Matrix Operating Environment Software (223 pages)
- Matrix Operating Environment Software (136 pages)
- Matrix Operating Environment Software (34 pages)
- Matrix Operating Environment Software (63 pages)
- Matrix Operating Environment Software (67 pages)
- Matrix Operating Environment Software (128 pages)
- Matrix Operating Environment Software (104 pages)
- Matrix Operating Environment Software (75 pages)
- Matrix Operating Environment Software (245 pages)
- Matrix Operating Environment Software (209 pages)
- Matrix Operating Environment Software (71 pages)
- Matrix Operating Environment Software (239 pages)
- Matrix Operating Environment Software (107 pages)
- Matrix Operating Environment Software (77 pages)
- Insight Management-Software (148 pages)
- Matrix Operating Environment Software (80 pages)
- Insight Management-Software (128 pages)
- Matrix Operating Environment Software (132 pages)
- Matrix Operating Environment Software (74 pages)
- Matrix Operating Environment Software (76 pages)
