How vs trends work, Monitoring – Physio-Control LIFEPAK 15 User Manual
Page 111
MONITORING
4
©2007-2013 Physio-Control, Inc.
LIFEPAK 15 Monitor/Defibrillator Operating Instructions
4-67
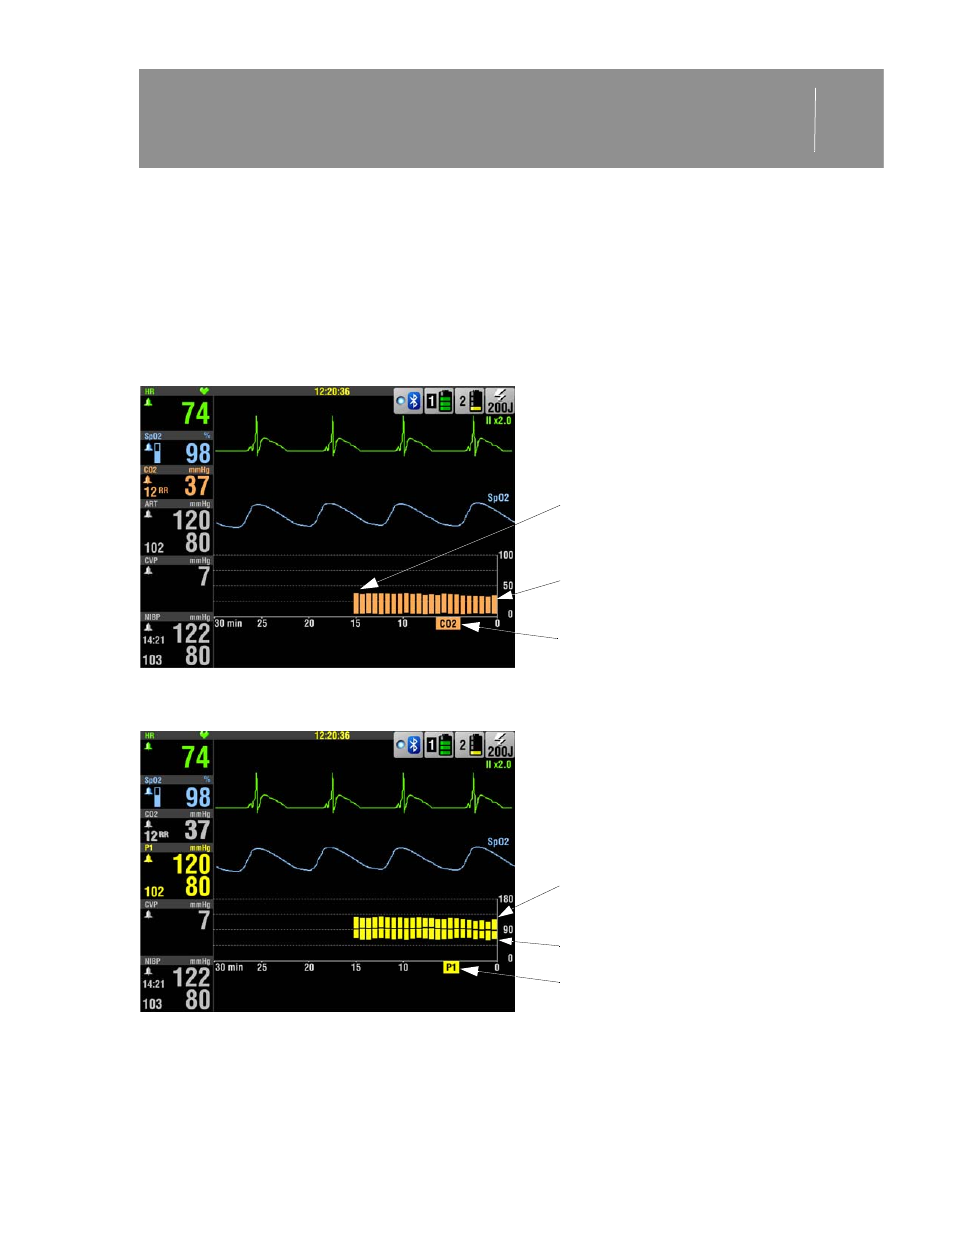
How VS Trends Work
Each active vital sign can be displayed graphically for time ranges of 30 minutes, and 1, 2, 4, and
8 hours. The vital signs are HR, SpO
2
, SpCO, SpMet, CO
2
, Temp, and RR; and systolic, diastolic,
and mean pressures. Data is sampled every 30 seconds. If valid data is not available, a blank space
is substituted on the graph. NIBP values are plotted only when an NIBP measurement is obtained.
VS measurements are not averaged or filtered. No messages or alarms occur based on changes in
VS measurements.
Figure 4-15 EtCO2 Trend Graph
Figure 4-16 Pressure Trend Graph
VS label
Most recent
ETCO
2
measurement
First ETCO
2
measurement
VS label
Systole
pressure
Diastolic
pressure