Voltage, Distortion, Dip/swell – Basler Electric BE1-11t User Manual
Page 190
178
9424200995 Rev H
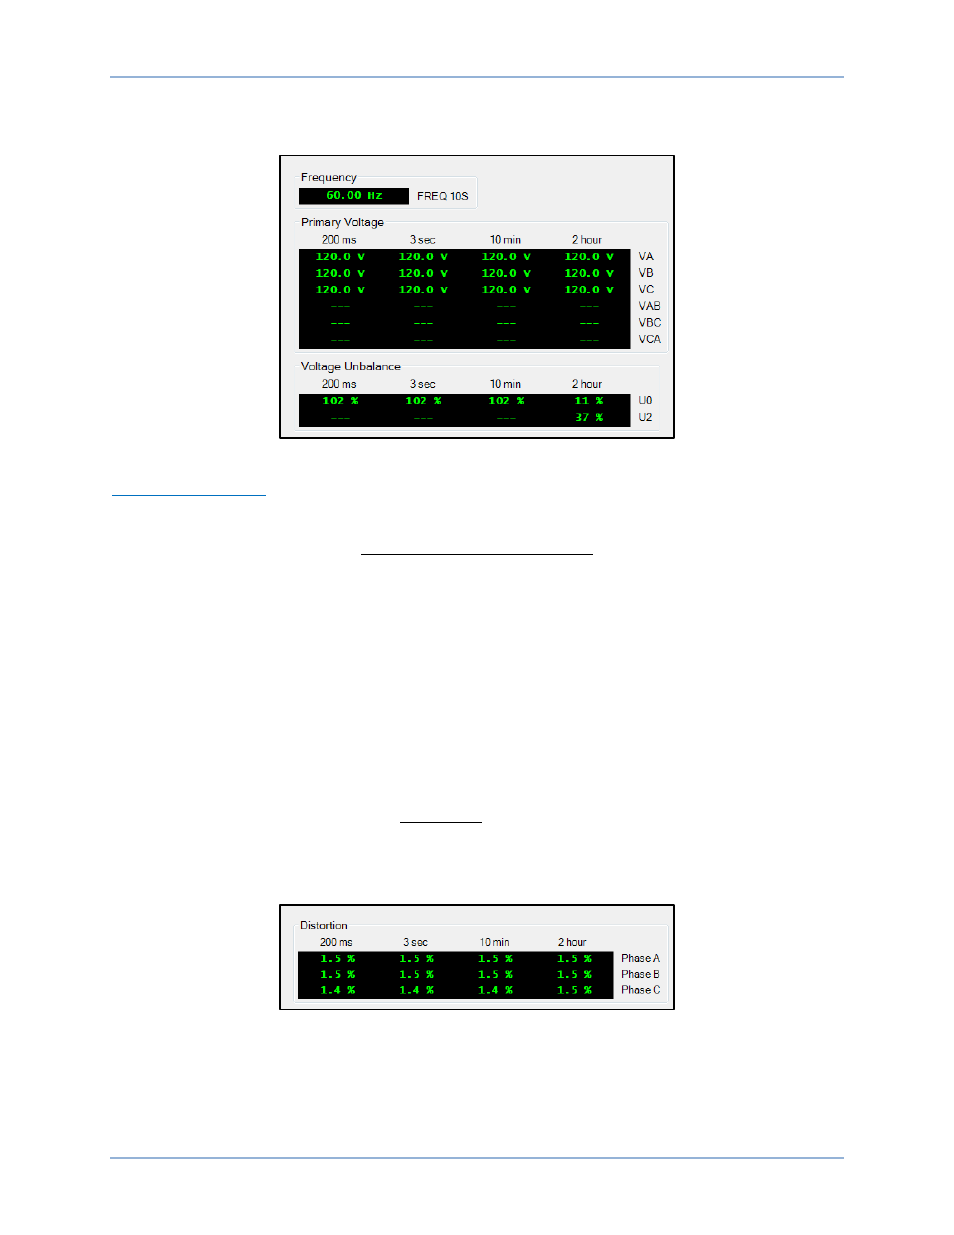
Voltage
Figure 131 illustrates the Power Quality, Voltage screen.
Figure 131. Power Quality, Voltage Screen
10-Second Frequency
A 10-second average of the frequency is calculated using Equation 23.
𝑁𝑢𝑚𝑏𝑒𝑟 𝑜𝑓 𝐼𝑛𝑡𝑒𝑔𝑟𝑎𝑙 𝐶𝑦𝑐𝑙𝑒𝑠
𝑇𝑜𝑡𝑎𝑙 𝐷𝑢𝑟𝑎𝑡𝑖𝑜𝑛 𝑜𝑓 𝐼𝑛𝑡𝑒𝑔𝑒𝑟 𝐶𝑦𝑐𝑙𝑒𝑠
Equation 23. 10-Second Frequency Calculation
Example
Number of integral cycles: 501 cycles over 10 s
Total duration of the 501 cycles: 9.998 s
10-Second Frequency = 501/9.998 = 50.1100 Hz
Distortion
The voltage during a dip is often distorted. This distortion may be important for understanding the effect of
the dip on the system. The BE1-11t calculates distortion using Equation 24.
�
𝑉
𝑇𝑜𝑡𝑎𝑙
𝑉
𝐹𝑢𝑛𝑑𝑎𝑚𝑒𝑛𝑡𝑎𝑙
− 1� × 100
Equation 24. Distortion Calculation
Figure 132 illustrates the Power Quality, Distortion screen.
Figure 132. Power Quality, Distortion Screen
Dip/Swell
Figure 133 illustrates the Power Quality, Dip/Swell screen. A green LED indicates that the threshold
specified in Power Quality Settings has been exceeded.
Power Quality
BE1-11t