Trend graph display – KEYENCE LS-7600 User Manual
Page 54
4-4
Chapter 4 Operation Control
4
■
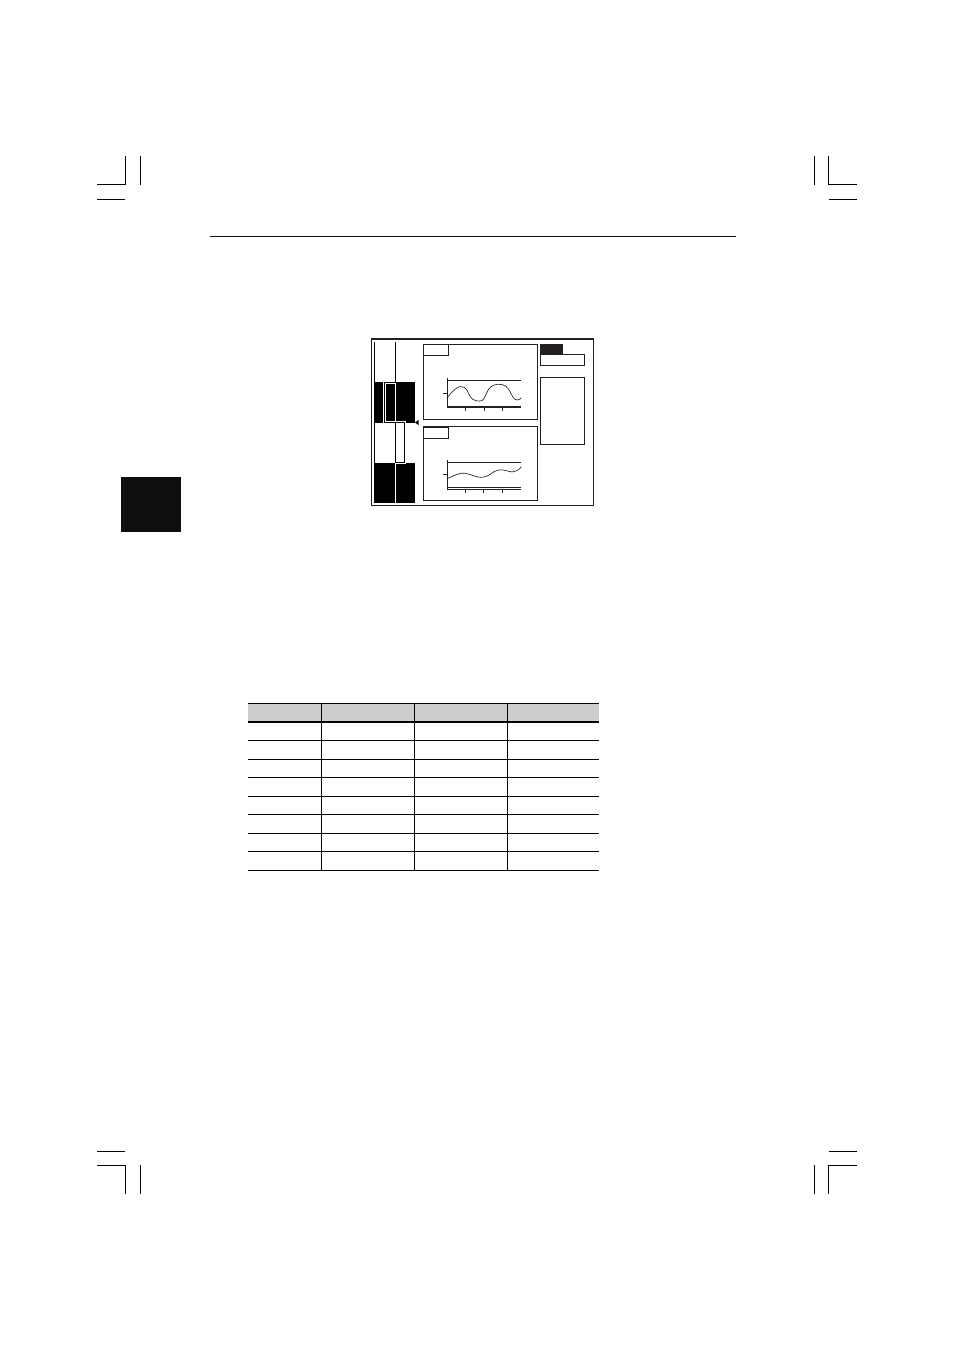
Trend Graph Display
Trend graph can be displayed when both outputs are displayed.
Trend Graph Display
OUT1
23.45670
OUT2
10.00015
CAM1
RUN
P – 00
AREA1
HEAD1
DIA
AREA2
HEAD1
DIA
A1 2
A2 2
01/02/18
17:50:42
24.10000
22.90000
1M
11.10000
8.90000
1M
❈
The Y-axis of trend graph is automatically set for the next set value and displayed
according to the tolerance set value.
• Reference value mode: (Reference value –A) to (Reference value +A)
A = (|Lower limit value| or |Upper limit value|, which ever is larger) x1.1
• Threshold mode: HH value to LL value
❈
A tolerance position is indicated with a yellow line.
• Reference value mode: Reference value + Upper limit and Reference value +
Lower limit
• Threshold mode: HI value and LO value
❈
The X-axis of a trend graph is set as graph TIME data. Refer to Option Settings on
page 5-55 for details.
Setting
1m
10m
30m
1H
2H
6H
12H
24H
Single-screen time
1 min
10 min
30 min
1 hr
2 hr
6 hr
12 hr
24 hr
Number of points
120 points
120 points
120 points
120 points
120 points
120 points
120 points
120 points
Refresh time
0.5 s
5 s
15 s
30 s
1 min
3 min
6 min
12 min
❈
A line is drawn between the maximum and minimum values of all the measuring
points in the refresh time and displayed as one-plot data in the X-axis direction.
❈
A trend graph has 50 points in the Y-axis direction and 120 points in the X-axis
direction.
❈
The screen is scrolled to the left to continue when a single-screen data is displayed.
❈
The data scrolled to the left cannot be returned and displayed again.