Graph – EXFO AXS-200/850 Ethernet Test Set User Manual
Page 100
RFC 2544
90
AXS-200/850
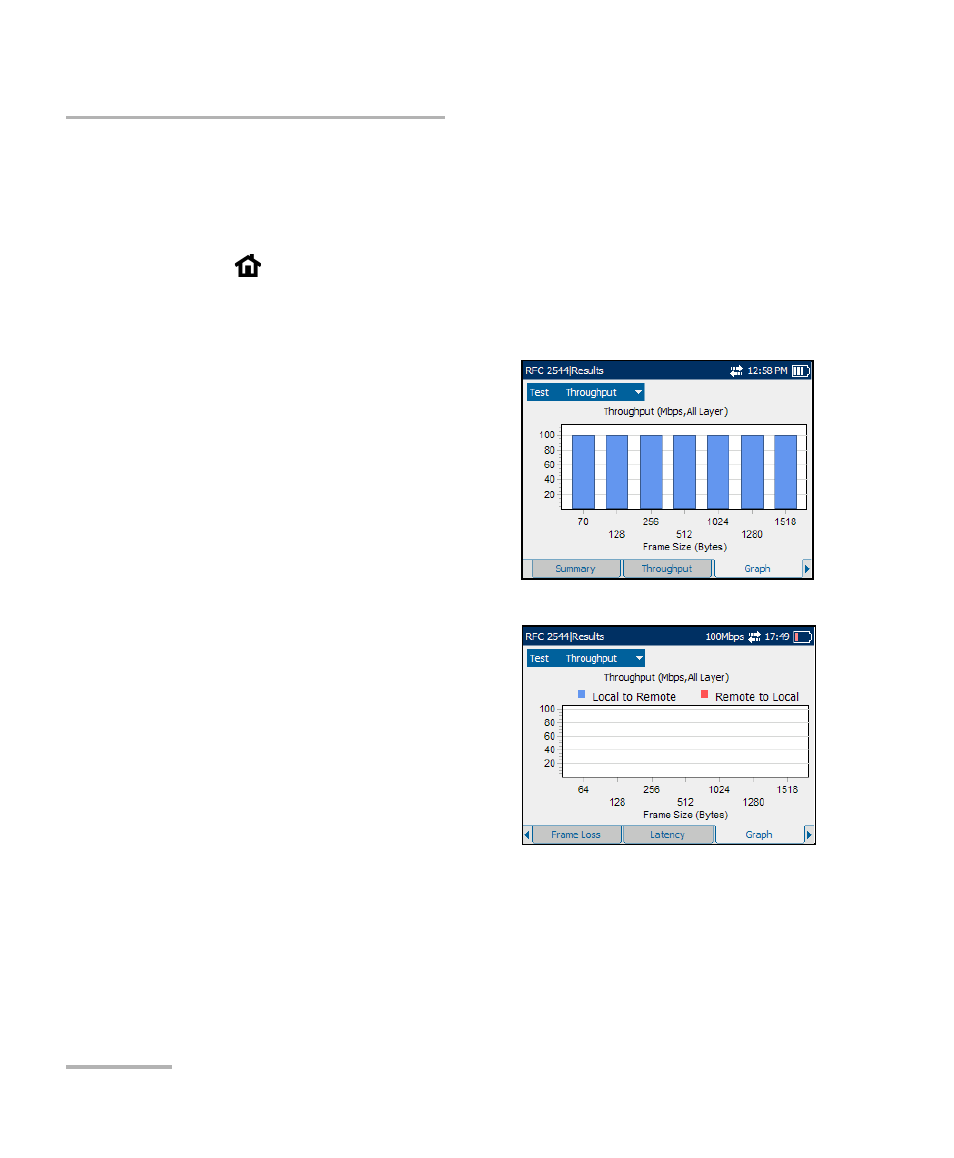
Graph
Graph
Gives the graph showing the Throughput, Back-to-Back, Frame Loss, or
Latency measurement.
Press ,
select RFC 2544, Results, and the Graph tab.
The X axis shows the frame sizes for Throughput, Back-to-Back, Latency
or the TX Rate for Frame Loss. The Y axis shows the subtest results.
³
Test: Select the test that has to be
displayed from the upper portion
of the tab. Choices are
Throughput, Back-to-Back,
Frame Loss, and Latency.
³
Frame Size (Bytes): For Frame
Loss subtest, select the Frame
Size results to be displayed.
Note: When the Dual Test Set parameter is
set to Local in Global Configuration on
page 58, the results are presented
independently for each direction:
Local-to-Remote and
Remote-to-Local.
See also other documents in the category EXFO Measuring instruments:
- ADSL2+ (124 pages)
- ADSL2+ (267 pages)
- ADSL2+ (275 pages)
- ARU-100 HPNA Test Probe (26 pages)
- ARU-100 HPNA Test Software Option for DSL/IP Tests (3 pages)
- AXS-100 Series OTDR (155 pages)
- AXS-200 SharpTESTER (70 pages)
- AXS-200/610 Copper Test Module (152 pages)
- AXS-200/650 IP Triple-Play Test Set (91 pages)
- CableSHARK P3 VF/DSL Cable Qualifier (321 pages)
- DC0091A (3 pages)
- ELS-500 Light Source (45 pages)
- EOT Series (2 pages)
- EPM-ELS-50 (206 pages)
- ETS-1000 (173 pages)
- ETS-1000G (195 pages)
- ETS-1000L (47 pages)
- EXpert IP Test Tools (62 pages)
- EXpert IPTV Test Tools (FTB-1 / 2 Pro) (82 pages)
- EXpert IPTV Test Tools (FTB-200v2) (82 pages)
- EXpert VoIP Test Tools (107 pages)
- FIP-400 Fiber Inspection Probe and ConnectorMax (78 pages)
- FIP-400B Fiber Inspection Probe Multifiber (2 pages)
- FIP-400B Fiber Inspection Probe and ConnectorMax2 (111 pages)
- FIP-425B/435B Fiber Inspection Probe and ConnectorMax2 Mobile (103 pages)
- FLS-110 Optical Polarized Source (18 pages)
- FLS-300 Light Source (40 pages)
- FLS-5800 CD/PMD Analyzer Source (106 pages)
- FLS-5800 CD/PMD Analyzer Source (98 pages)
- FLS-5800 (6 pages)
- FLS-600 Light Source (79 pages)
- FOA Compatibility (3 pages)
- FOT-5200 Coarse Spectrum Analyzer (47 pages)
- FOT-930 Multifunction Loss Tester (111 pages)
- FTB -5240S/5240BP Optical Spectrum Analyzer for FTB 500 (NS-1434) (537 pages)
- FTB-5230S Optical Spectrum Analyzer for FTB 200 v2 (659 pages)
- FTB-5230S Optical Spectrum Analyzer for FTB 200 v2 (251 pages)
- FTB -5240S/5240BP Optical Spectrum Analyzer (638 pages)
- FTB-1 (234 pages)
- FTB-2 Pro (6 pages)
- FTB-2 Pro (443 pages)
- FTB-200 v2 Compact Modular Platform (222 pages)
- FTB-2200 for FTB-200 v2 (41 pages)
- FTB-3930 MultiTest (101 pages)