Multichannel Systems MC_Rack Manual User Manual
Page 47
Step by Step Tutorial
41
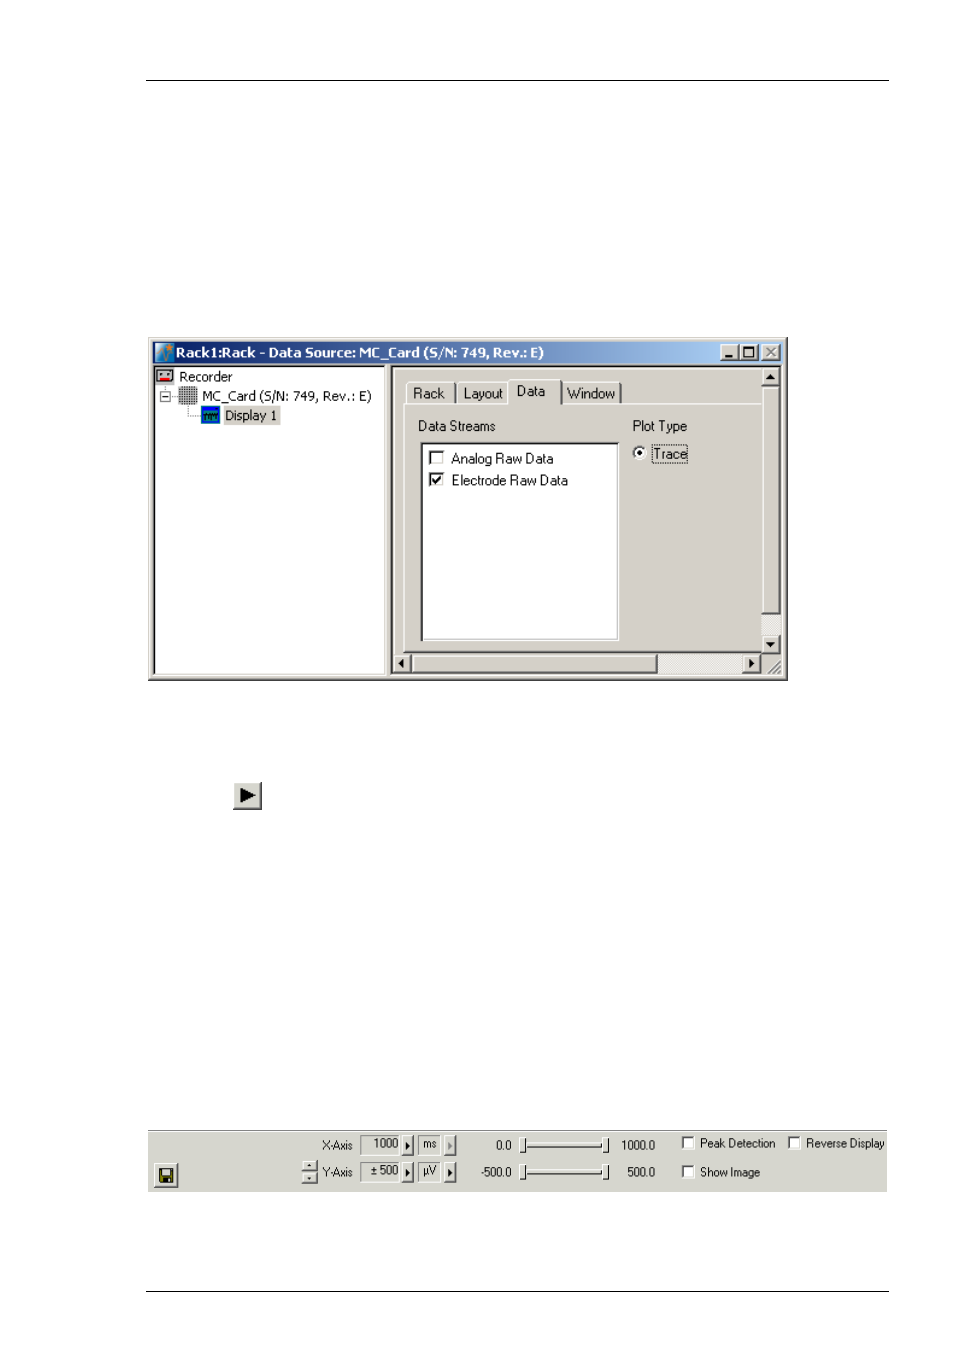
Selecting data streams
1. Click
the
Data tabbed page.
In this page, you select the data streams that you want to monitor in the display. The Electrode
Raw Data stream is already preselected. You can select the Analog Raw Data stream if you have
connected a data source to an analog data input (A1 A2 and A3 for the MEA-System). It may make
more sense to display the additional analog channels in a separate display, though, because in
most cases, the scale of the axes will not be appropriate for both the electrode data stream and
the additional analog data stream. For monitoring the digital data stream, please use the Digital
Display. The Data Display has an oscilloscope-like function. Therefore, only the Trace option
is available. The Parameter Display for graphing extracted parameters provides more options.
Starting MC_Rack
Click Start
(either on the Measurement menu, the toolbar, or the Rack tabbed page) to
start the data acquisition. Each virtual instrument in the rack starts to process the channels and
data streams that were assigned to it, that is, the Trigger Detector detects events on the digital
input channel and generates a trigger data stream that, in turn, triggers the display. The display
is refreshed at each trigger event.
Refresh rate and ranges
1. Switch to the Display 1 window.
2. You
can
zoom in the signals by choosing the appropriate range of the y-axis from the Y-Axis
drop-down list, or by clicking the arrow buttons.
3. You can select the display refresh rate and maximum x-axis range from the X-Axis drop-down
list.
4. You can fine-tune the ranges of the y- and x-axis with the sliders.