Multichannel Systems MC_Rack Manual User Manual
Page 163
MC_Rack Features
157
When monitoring faster signals like neuronal spikes, a bin size of 1 s will generally be fine.
For special applications, it can make sense to use a smaller bin size, that is, if you are interested
more in the organization of signals than in the overall spike rate. For example, if the Analyzer
extracts the spike number in 100 ms bins, you will get a pattern of empty and non-empty bins
(with a majority of empty bins) if the spike pattern is highly organized in bursts. If the activity
is more random or distributed over time, the number of empty bins will be lower. (See example
rack Neurons_DrugApplications_Demo.rck.)
Another example: You can extract the spike rate in 10 ms bins, and use the false color plot
as an "LED display", that is, electrodes will light up each time if there is any spike activity
on the electrode, refreshed each 10 ms. (See example rack Neuro_Spikes_LED_Display.rck.)
For longterm experiments (over weeks or months), a higher bin size might be appropriate for
reducing the amount of data points. For example, you can extract the spike rate each 5 min.
(See example rack SpikeRate_5minBins.rck.)
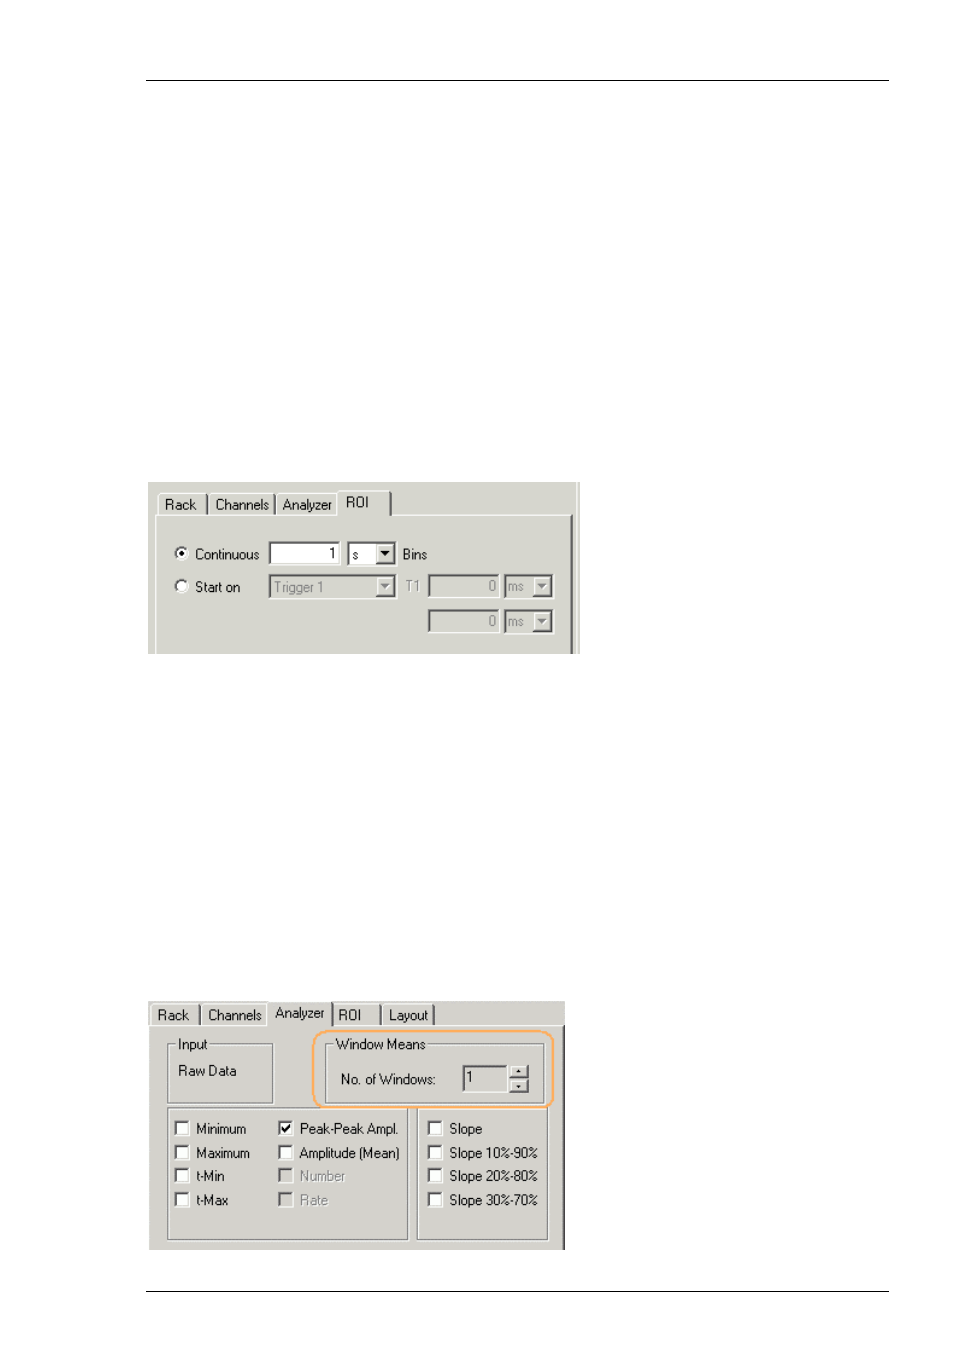
1. Set up a rack with an Analyzer.
2. Click
the
ROI tab of the Analyzer.
3. Select the option Continuous and enter the appropriate time window (Bin).
Averaging Extracted Parameters
You can average the parameters over several intervals. For example, if you choose intervals
of 1 s, the parameter, for example the spike rate, is measured for 1 s intervals.
For example, the spike number may be 80 in the first second, 30 in the second second,
and 40 in the third second, and so on. If you have set the number of windows to 3,
the spike rate of the first three intervals (three seconds in total) is averaged, resulting
in a mean value of 50 Hz:(80 + 30 + 40) : 3 = 50.
If you have triggered data, the time window refers to the region of interest.
Set the number of windows to 1, if you do not want to average data.
1. Click
the
Analyzer tab of the Analyzer.
2. Under
Window Means, enter the number of time windows that should be averaged.