Multichannel Systems MC_Rack Manual User Manual
Page 152
MC_Rack Manual
146
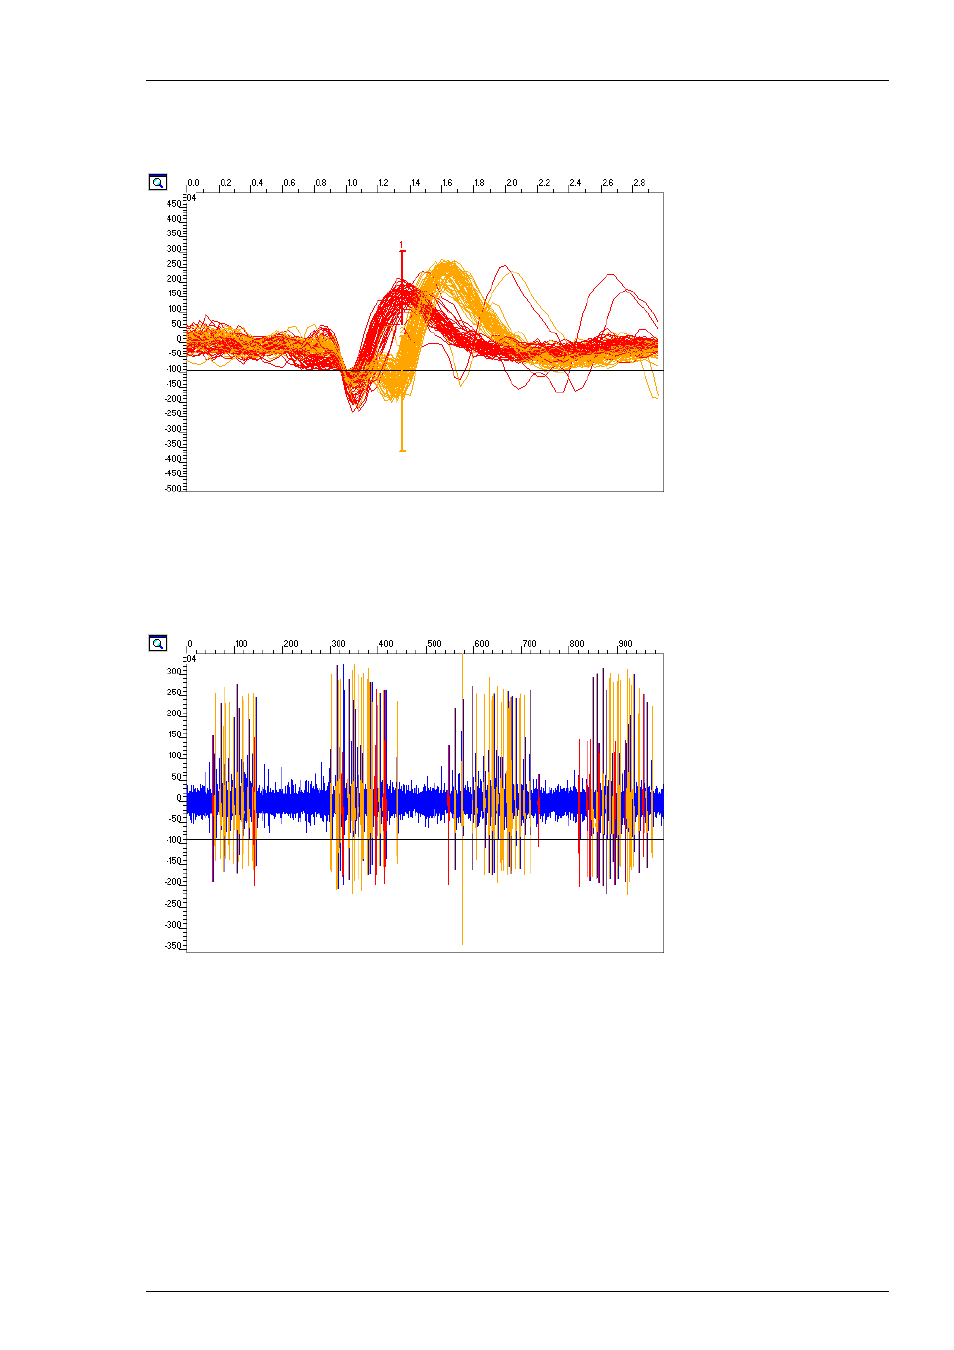
The following illustration shows the activity of two neurons, as spike cutouts on a small time basis.
The first (red) signal has one peak, the second (yellow) spike waveform shows a small peak
followed by a bigger peak. The window bars are positioned at the time point where both signals
differ most. 100 spikes are overlaid in this plot.
When zooming into a channel in Spike Sorter overlay mode (as shown above) be aware that
the traces might be displayed in low quality, that means, you can discriminate single pixels.
The quality of the picture increases when the display is refreshed.
The next illustration shows the sorted spikes (Raw Data). The blue signals do not belong
to either of the two units.
See also other documents in the category Multichannel Systems Equipment:
- MATLAB Manual (21 pages)
- MEA-IT Manual (30 pages)
- MEA-VMT Manual (17 pages)
- USB-ME64-128-256-Systems Manual (36 pages)
- LTP-Director Manual (89 pages)
- MPA2I Manual (12 pages)
- MPA32I Manual (39 pages)
- MPA8I Manual (22 pages)
- MEA2100-System Manual (72 pages)
- nanoZ manual (45 pages)
- Wireless-System Manual (62 pages)
- µPA16+32 Manual (21 pages)
- Portable_ME-System Manual (45 pages)
- MEA2100-System (6 pages)
- MEA2100-System (2 pages)
- STG4002 Manual (110 pages)
- MEA2100-CO2-C (1 page)
- USB-MEA256-System Manual (66 pages)
- MEA Manual (135 pages)
- PGA Manual (29 pages)
- TC01-2 Manual (30 pages)
- STG1000 Manual (89 pages)
- PH01 Manual (10 pages)
- ME-System Manual (31 pages)
- STG3008-FA Manual (101 pages)
- STG-Lite Manual (27 pages)
- USB-MEA32-STIM4 Manual (50 pages)
- HiClamp Manual (81 pages)
- MEAS21+MEASwitchUSB Manual (23 pages)
- MEAS42+MEASwitchUSB Manual (23 pages)
- MEA_Signal_Generator Manual (29 pages)
- MEA1060-Inv Manual (35 pages)
- MEA1060-Inv-BC Manual (64 pages)
- MEA1060-Up Manual (36 pages)
- MEA1060-Up-BC Manual (64 pages)
- Roboocyte2 JavaScript Manual (5 pages)
- Roboocyte2 Scripting Manual (36 pages)
- PS40W Manual (9 pages)
- PPS2 Manual (26 pages)
- STG4004+STG4008 Manual (114 pages)
- Roboocyte2 Manual (115 pages)
- TC01-TC02 Manual (33 pages)
- Roboinject Manual (91 pages)
- MEA-System Manual (28 pages)