Multichannel Systems MC_Rack Manual User Manual
Page 166
MC_Rack Manual
160
You can choose between four different false color maps. The False Color plot shows only the
current values as colors without information about the time. Each parameter value is assigned to
one of 64 colors (defined by the Color Map). There is no time axis, the plot is refreshed according
to the Window settings of the Analyzer.
Scrolling back and forward is not available for this plot type, but will be enabled in future
versions. The scroll arrows are present but inactive.
Note: Only one input data stream can be displayed in a
False Color
plot.
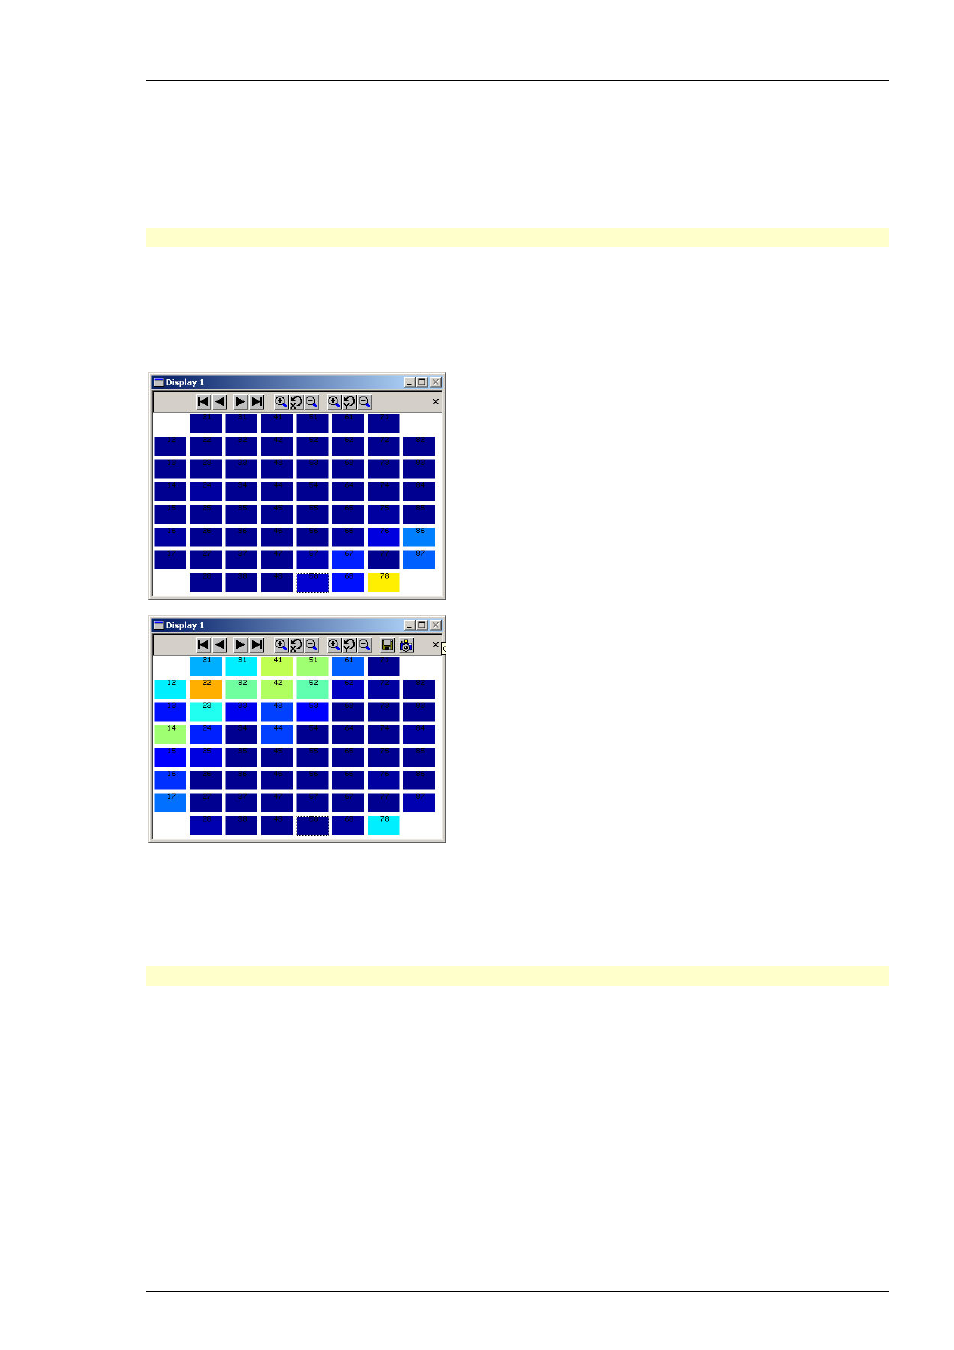
The following screen shots show a False Color plot (Color Map Jet) of a spike rate. An Analyzer
has been used to extract the spike rate and a Parameter Display to display the False Color plot.
The first screen shot shows the right region firing, the second shows the left slice firing. You see
now clearly that both brain slices fire independently.
4.15.6 Number Plot
The Number plot shows the current parameter value (for example the spike rate of a neuron)
as a number.
Note: Only one input data stream can be displayed in a
Number
plot.
Scrolling back and forward is not available for this plot type, but will be enabled in future
versions. The scroll arrows are present but inactive.