Sampling color for analysis – Apple Color 1.5 User Manual
Page 203
The cones of the human eye that are sensitive to color have differing sensitivities to each
of the primaries (red, green, and blue). As a result, a mathematically linear distribution of
analyzed color is not necessarily the most accurate way to represent what we actually
see. The IPT color space rectifies this by redistributing the location of hues in the color
space according to tests where people chose and arranged an even distribution of hues
from one color to another, to define a spectrum that “looked right” to them.
In the IPT color space, I corresponds to the vertical axis of lightness (desaturated black
to white) running through the center of the color space. The horizontal plane is defined
by the P axis, which is the distribution of red to green, and the T axis, which is the
distribution of yellow to blue.
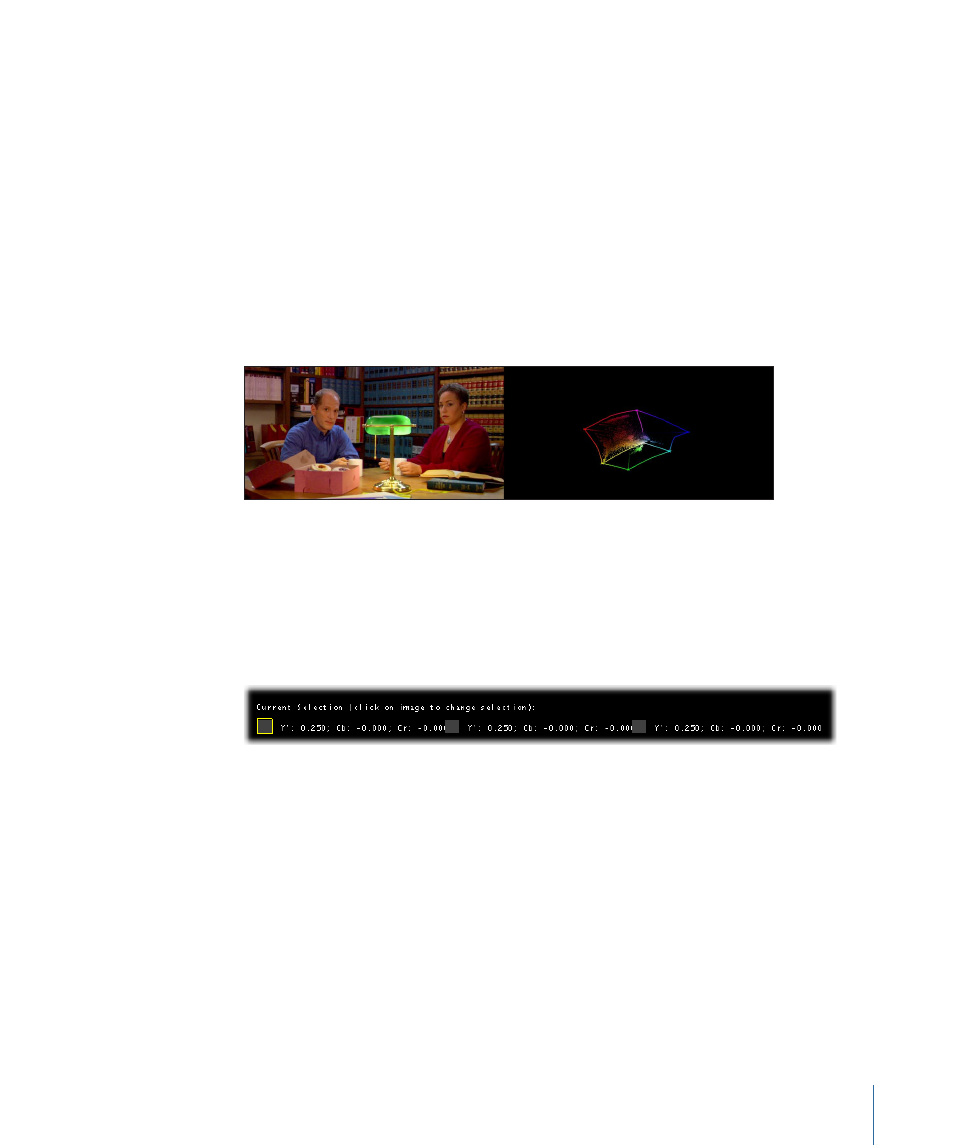
Here’s an analysis of the test image within this color space.
Sampling Color for Analysis
The 3D video scope also provides controls for sampling and analyzing the color of up to
three pixels within the currently displayed image. Three swatches at the bottom of the
video scope let you sample colors for analysis by dragging one of three correspondingly
numbered crosshairs within the image preview area. A numerical analysis of each sampled
color appears next to the swatch control at the bottom of the 3D video scope.
The color channel values that are used to analyze the selected pixel change depending
on which color space the 3D scope is set to. For example, if the 3D scope is set to RGB,
then the R, G, and B values of each selected pixel will be displayed. If the 3D scope is
instead set to Y
′
C
B
C
R
, then the Y
′
, C
B
, and C
R
values of the pixel will be displayed.
You can choose different samples for each shot in the Timeline, and the position of each
shot’s sampling crosshairs is saved as you move the playhead from clip to clip. This makes
it easy to compare analogous colors in several different shots to see if they match.
203
Chapter 8
Analyzing Signals Using the Video Scopes