The r, g, and b histograms, The luma histogram – Apple Color 1.5 User Manual
Page 199
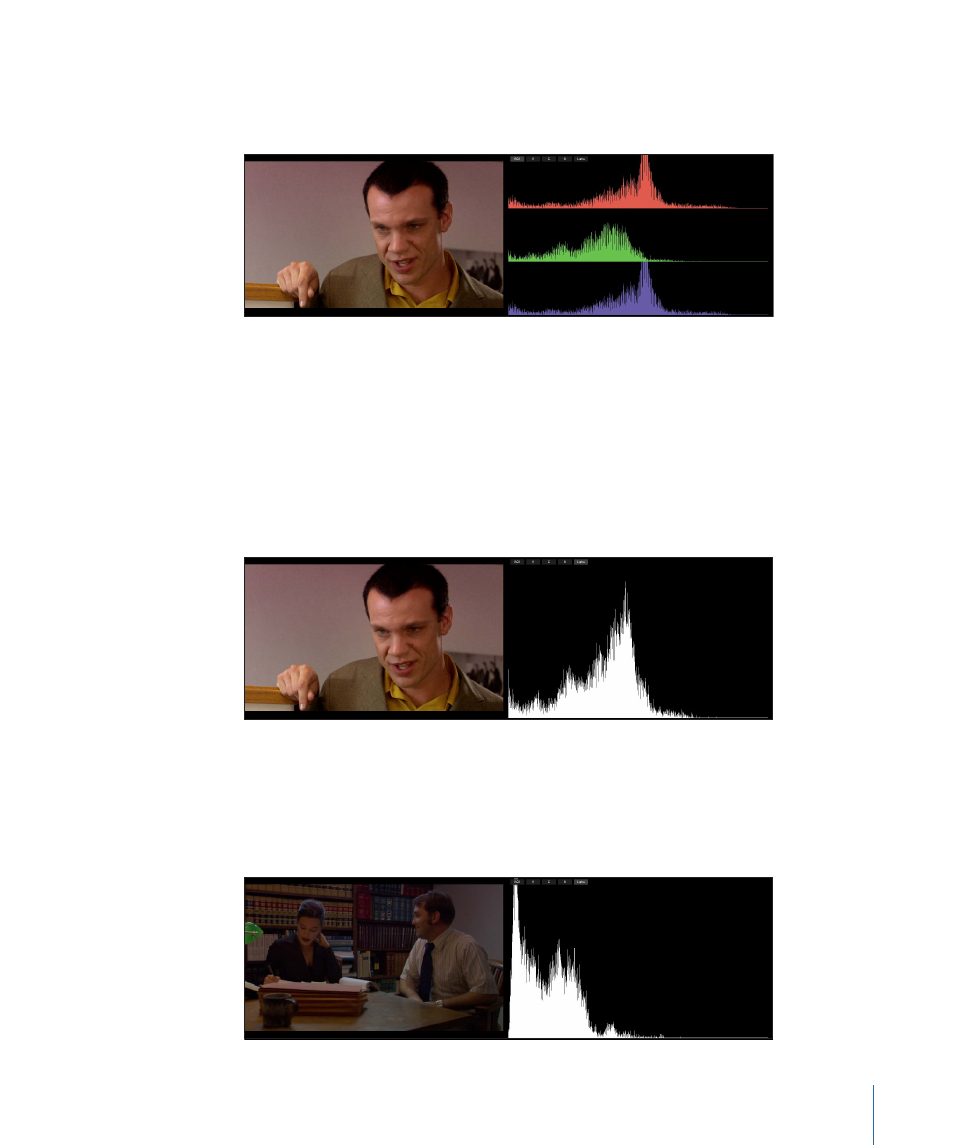
For example, images with a red color cast have either a significantly stronger red histogram,
or conversely, weaker green and blue histograms. In the following example, the red cast
in the highlights can be seen clearly.
The R, G, and B Histograms
The R, G, and B histograms are simply isolated versions of each channel’s histogram graph.
The Luma Histogram
The Luma histogram shows you the relative strength of all luminance values in the video
frame, from black to super-white. The height of the graph at each step on the scale
represents the number of pixels in the image at that percentage of luminance, relative
to all the other values. For example, if you have an image with few highlights, you would
expect to see a large cluster of values in the Histogram display around the midtones.
The Luma histogram can be very useful for quickly comparing the luma of two shots so
you can adjust their shadows, midtones, and highlights to match more closely. For
example, if you were matching a cutaway shot to the one shown above, you can tell just
by looking that the image below is underexposed, but the Histogram gives you a reference
for spotting how far.
199
Chapter 8
Analyzing Signals Using the Video Scopes