The vectorscope, Comparing saturation with the vectorscope – Apple Color 1.5 User Manual
Page 195
The Vectorscope
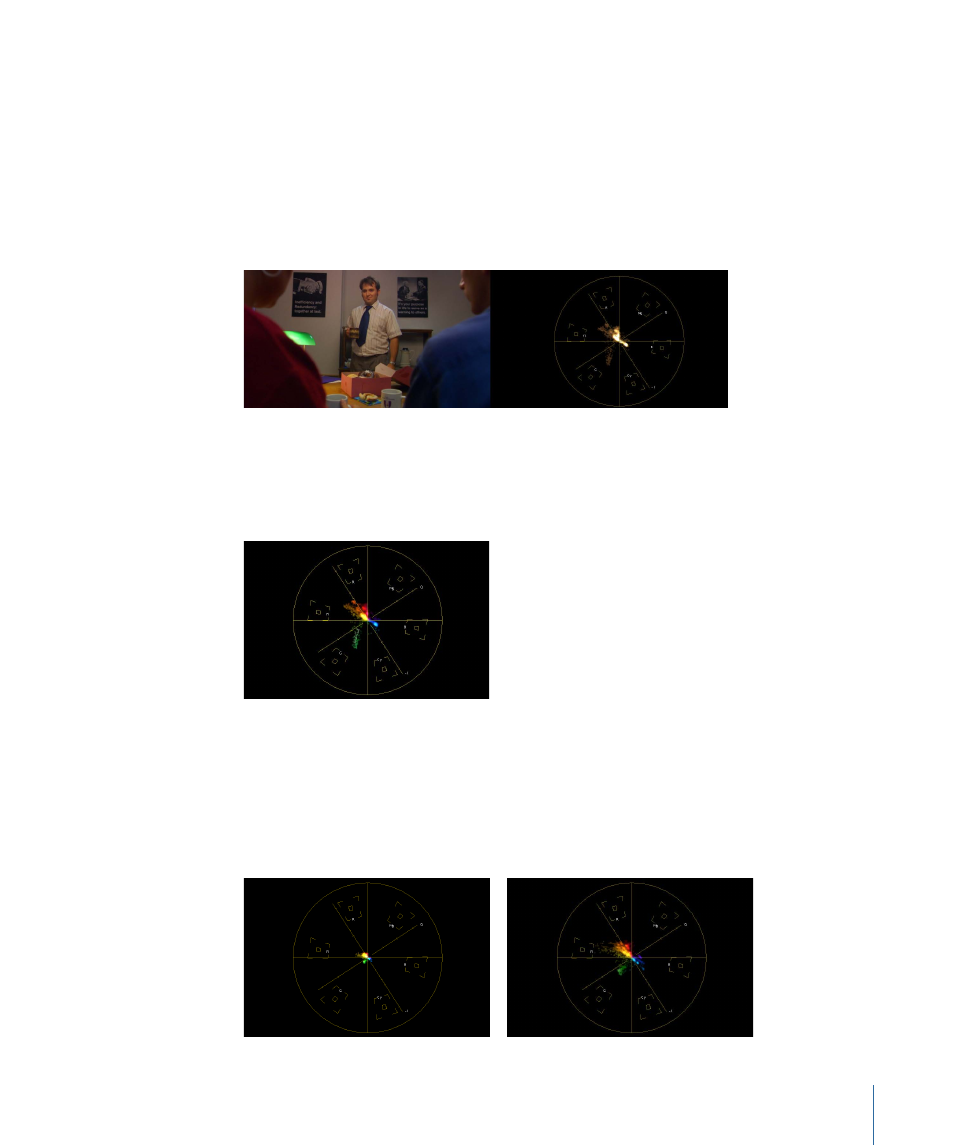
The Vectorscope shows you the overall distribution of color in your image against a
circular scale. The video image is represented by a graph consisting of a series of connected
points that all fall at about the center of this scale. For each point within the analyzed
graph, its angle around the scale indicates its hue (which can be compared to the color
targets provided), while its distance from the center of the scale represents the saturation
of the color being displayed. The center of the Vectorscope represents zero saturation,
and the farther from the center a point is, the higher its saturation.
If the Monochrome Scopes option is turned off in the User Prefs tab of the Setup room,
then the points of the graph plotted by the Vectorscope will be drawn with the color
from that part of the source image. This can make it easier to see which areas of the graph
correspond to which areas of the image.
Comparing Saturation with the Vectorscope
The Vectorscope is useful for seeing, at a glance, the hue and intensity of the various
colors in your image. Once you learn to identify the colors in your shots on the graph in
the Vectorscope, you will be better able to match two images closely because you can
see where they vary. For example, if one image is more saturated than another, its graph
in the Vectorscope will be larger.
195
Chapter 8
Analyzing Signals Using the Video Scopes