The 3d scope, The rgb color space – Apple Color 1.5 User Manual
Page 200
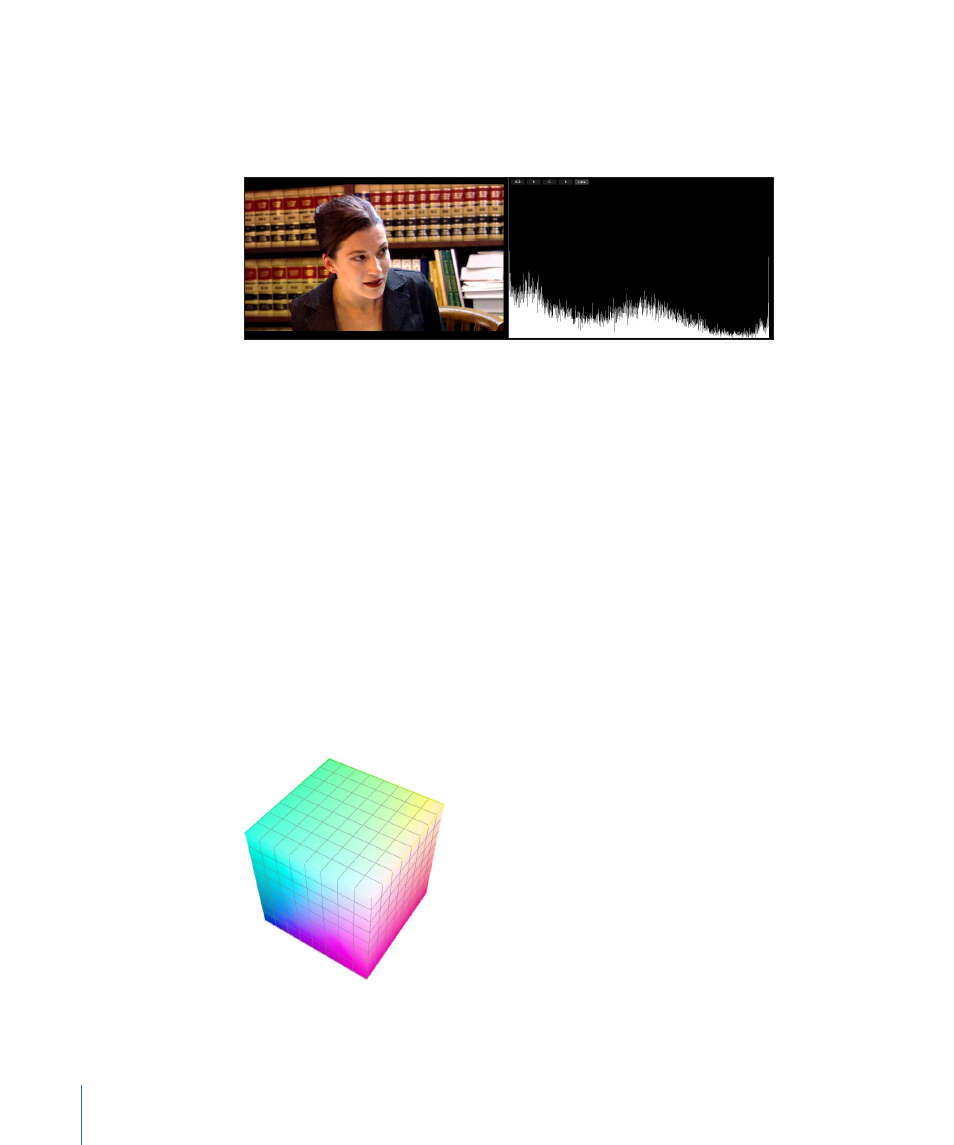
The shape of the Histogram is also good for determining the amount of contrast in an
image. A low-contrast image, such as the one shown above, has a concentrated clump
of values nearer to the center of the graph. By comparison, a high-contrast image has a
wider distribution of values across the entire width of the Histogram.
The 3D Scope
This scope displays an analysis of the color in the image projected within a 3D area. You
can select one of four different color spaces with which to represent the color data.
The RGB Color Space
The RGB color space distributes color in space within a cube that represents the total
range of color that can be displayed:
• Absolute black and white lie at two opposing diagonal corners of the cube, with the
center of the diagonal being the desaturated grayscale range from black to white.
• The three primary colors—red, green, and blue—lie at the three corners connected to
black.
• The three secondary colors—yellow, cyan, and magenta—lie at the three corners
connected to white.
In this way, every color that can be represented in Color can be assigned a point in three
dimensions using hue, saturation, and lightness to define each axis of space.
200
Chapter 8
Analyzing Signals Using the Video Scopes