Performance view, Figure 10: performance view, 10 performance view – HP StorageWorks 2.140 Director Switch User Manual
Page 51
Overview
49
Director Element Manager User Guide
Performance View
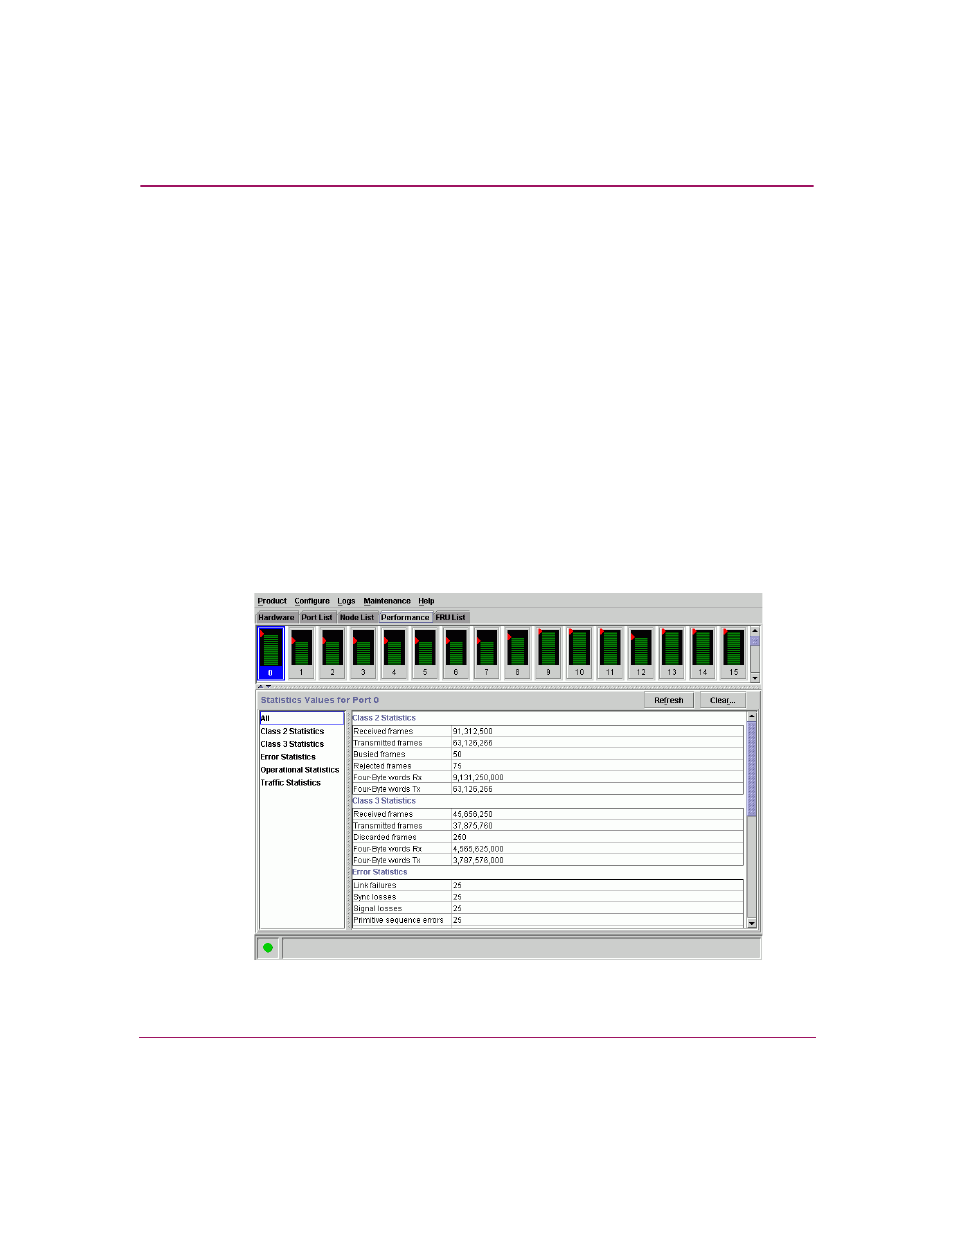
To display the Performance View, click the Performance view tab. The
Performance View, as shown in
, displays. This view provides a
graphical display of performance for all ports. The top portion of the Performance
View displays bar graphs that show the level of transmit/receive activity for each
port. (Use the scroll bar to view bar graphs for all the ports.) The information in
this view updates every five seconds. Each bar graph also shows the percentage
link utilization for the port. A red arrow marks the highest utilization level reached
since the Performance View was opened. If the system detects activity on a port, it
represents minimal activity with at least one bar.
When an end device (node) is logged in to a port, moving the mouse pointer over
the port’s bar graph in the Performance View highlights the graph and displays a
message with the WWN of the connected node. If the connected node has more
than one port, this is the WWN of the specific port on the node. When a port is
functioning as an expansion port (E_Port), the message is
E_Port
. When a port
is not logged into an end-device (not functioning as an F_Port) or to another
director (not functioning as an E_Port), the message is the port’s current online
state.
Figure 10: Performance View