Processor states – HP Integrated Lights-Out 2 User Manual
Page 116

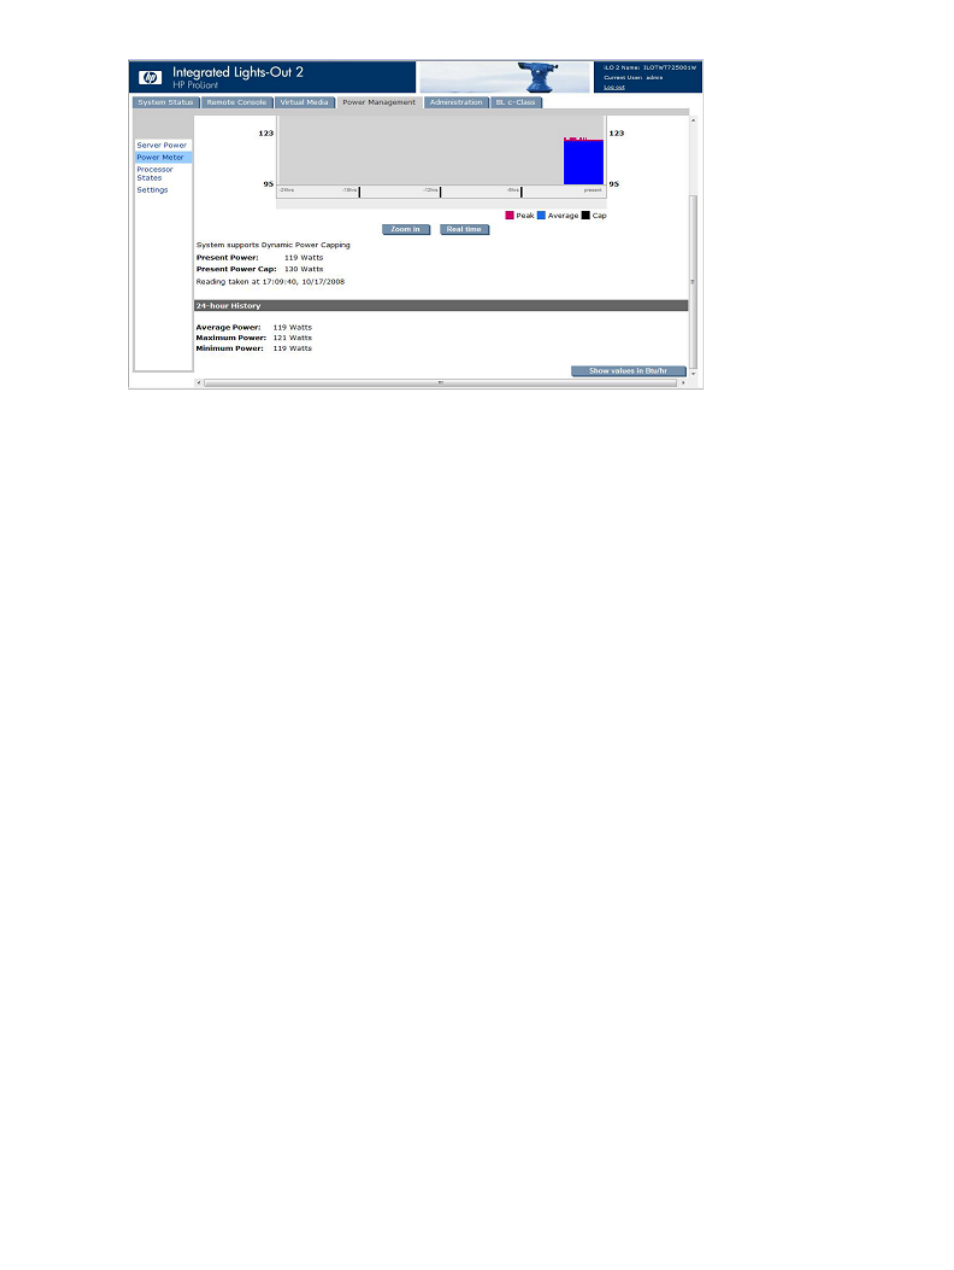
The Power Meter Readings section displays the following:
•
The data graph displays the power usage of the server over the previous 24 hours. iLO 2
collects power usage information from the server every 5 minutes. For each five-minute interval,
the peak and average power usage is stored in a circular buffer. These two values appear in
the form of a bar graph, with the average values in blue and the peak values in red. This data
resets whenever either the server or iLO 2 is reset.
◦
To increase visibility, click Zoom in, which increases the horizontal width of the data bars
on the Power Data Graph. A slider appears in this mode to enable inspection of the data
in the same size window.
◦
To view current power utilization, click Real Time. The Real Time data graph displays
power consumption information over the previous 20 minutes, including peak power,
average power, and the power cap. This button is only available when power cap is
enabled.
•
Current support for Dynamic Power Capping
•
Present Power value displays the current power reading from the server.
•
Present Power Cap displays the current power cap setting.
The 24-Hour History section displays the following:
•
Average Power Reading displays the average of the power readings from the server over the
last 24-hour period. If the server has not been running for 24 hours, the value is the average
of all the readings since the server was booted.
•
Maximum Power displays the maximum power reading from the server over the last 24-hour
period. If the server has not been running for 24 hours, the value is the maximum of all the
readings since the server was booted.
•
Minimum Power displays the minimum power reading from the server over the last 24-hour
period. If the server has not been running for 24 hours, the value is the minimum of all the
readings since the server was booted.
•
Show value in BTUs changes the displayed data from watts to BTUs.
Processor states
The Power Regulator for ProLiant Data page enables you to view processor states (p-state) and a
running average of the percentage of time each logical processor has spent in each p-state over
the previous 24-hours. Click Refresh to update the p-state data graph.
116
Using iLO 2
