2 reports at the link transaction level, 18 show metrics in the bus utilization window – Teledyne LeCroy Summit T28 PCIe Multi-lane Protocol Analyzer User Manual User Manual
Page 215
Summit T28 PCI Express Multi‐Lane Protocol Analyzer User Manual
203
Show Metrics in the Bus Utilization Window
Teledyne LeCroy
10.17.2 Reports at the Link Transaction Level
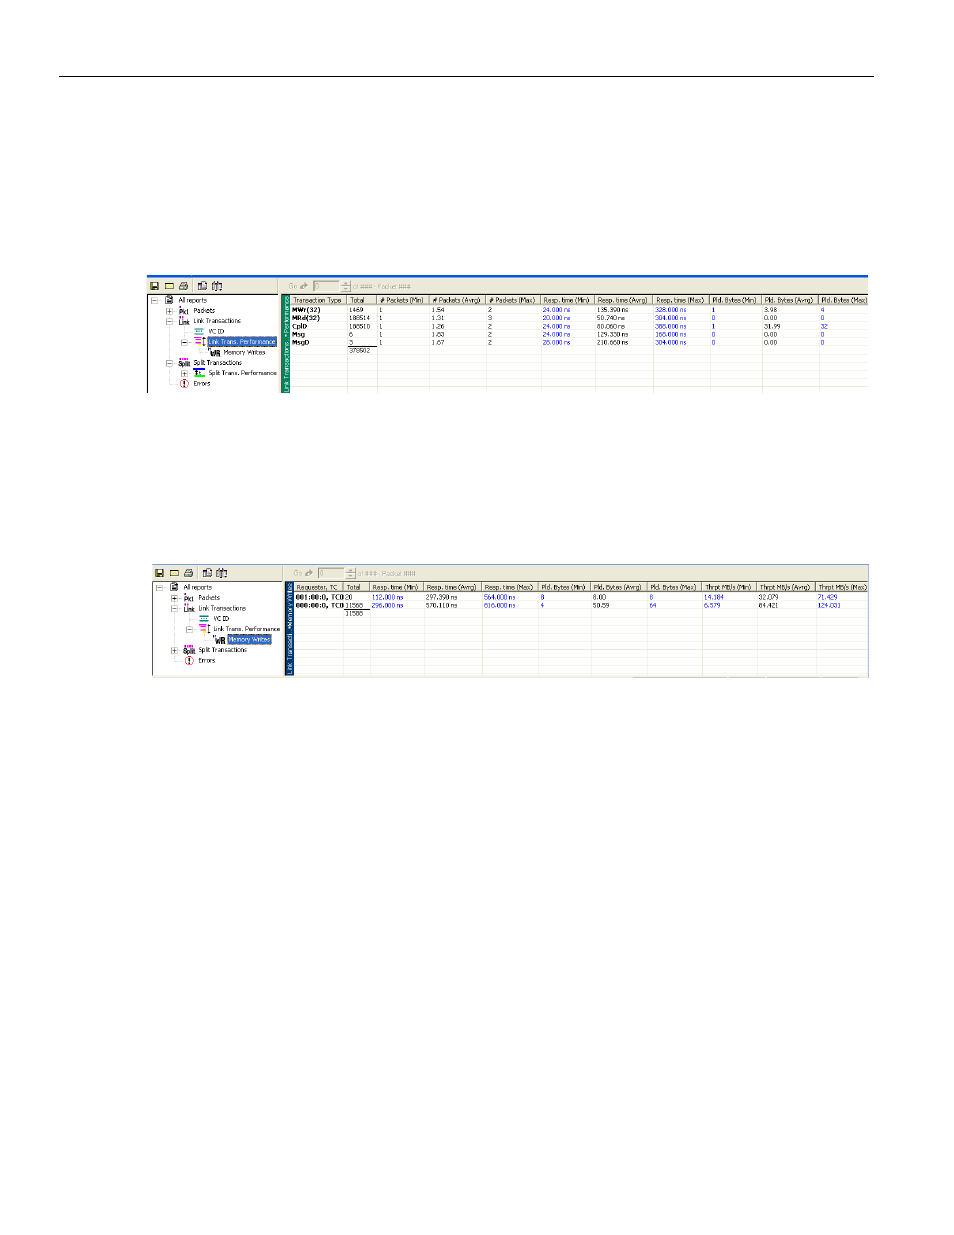
The following metric‐based reports are displayed at the Link Transaction level:
Link Transaction Performance: This report table groups the Link Transactions by TLP Type
and displays Minimum/Average/Maximum data for Number Of Packets, Response Time
and Payload Bytes metrics.
Memory Writes: This report table includes only the Link Transactions that present
Memory Write Requests. Memory Writes are the only (posted) requests that don't get
promoted to the Split transaction level, therefore their performance should be viewed at
the Link transaction level. The table groups Memory Writes by the combination of
Requester ID and Traffic Class and displays Minimum/Average/Maximum data for
Response Time, Payload and Throughput metrics.
The following features apply to all of the report tables described above for the Split
Transaction and Link Transaction levels:
Each report row for the defined tables contains the total number of units in this
group for the CATC Trace (total number of units for Split Transaction perfor‐
mance, Read Requests performance, Memory Writes, and so on).
In many cases, the Maximum and Minimum values in the report tables are navi‐
gable. By clicking table cells, you reposition the corresponding CATC Trace view
to the Split or Link Transaction that has yielded this maximum or minimum value.
This can help you to find specific units in the CATC Trace, such as transactions
that produced spikes in Response Time or Throughput.
10.18 Show Metrics in the Bus Utilization Window
The Bus Utilization window provides graphs for packet‐level information in the
CATC Trace. The window also provides graphs for information on Split and Link
Transaction levels, plotted over time. The graphs for Split and Link Transaction levels are
based on metrics collected for the transactions throughout the CATC Trace.
The seven graphs related to Split and Transaction levels are:
1. Pending Requests at Split Transaction level.
2. Response Time at Split Transaction level.