Performance view, Figure 7 performance view (edge switch 2/32), 7 performance view (edge switch 2/32) – HP StorageWorks 2.32 Edge Switch User Manual
Page 34
Element Manager overview
34
•
Display options—Allows you to display attached devices listed under the Port WWN
column in the Node List View by the device’s nickname, configured through the Define
Nickname menu option or the device's WWN.
These options are also available when you click a port row and then select Product > Port.
For details on navigating and monitoring via the Node List View, see ”
Performance View
Click the Performance view tab.
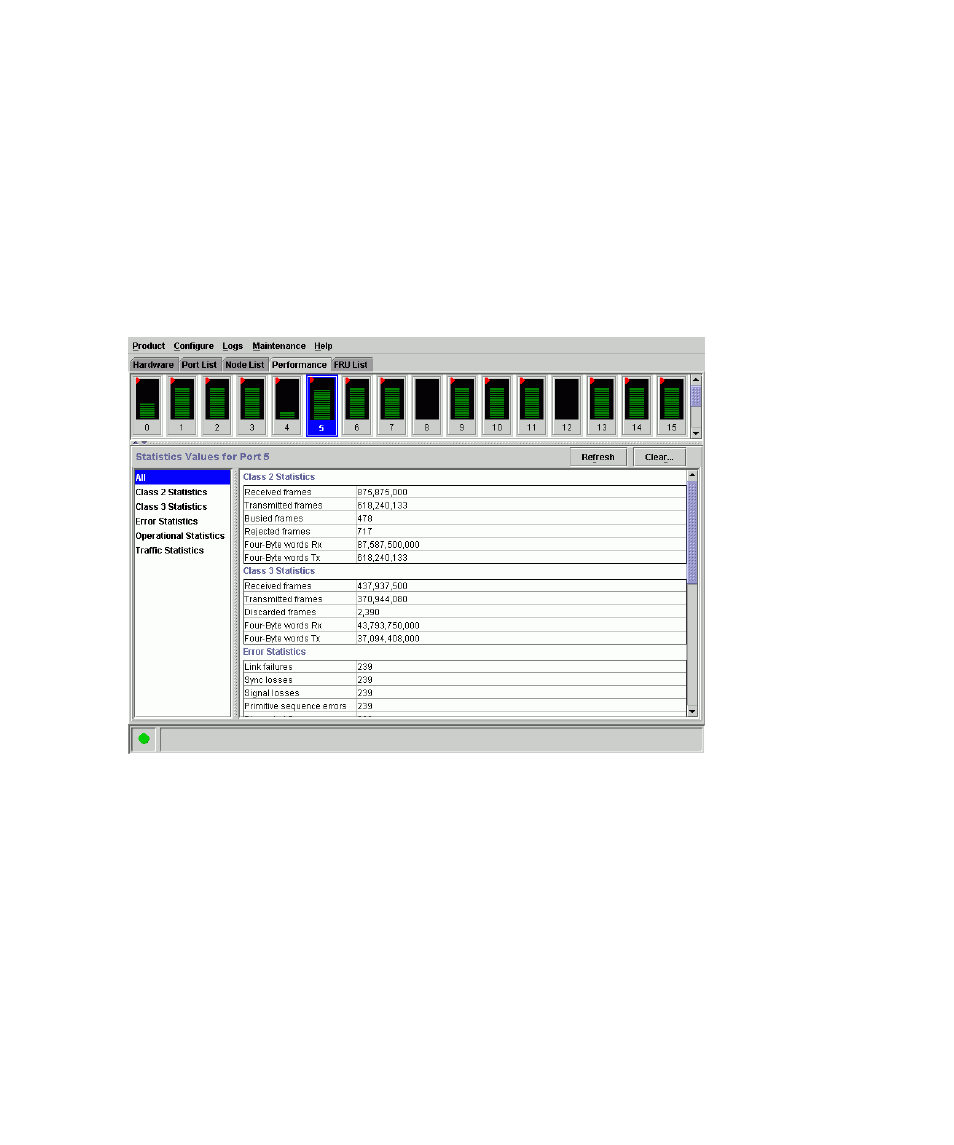
shows an example of the Performance View. This view
provides a graphical display of performance for all ports. The top portion of the Performance View
displays bar graphs that show the level of transmit/receive activity for each port. (Use the scroll bar
to view bar graphs for all the ports.) The information in this view updates every five seconds.
Figure 7
Performance View (Edge Switch 2/32)
Each bar graph also shows the percentage link utilization for the port. A red arrow marks the
highest utilization level reached since the Performance View was opened. If the system detects
activity on a port, it represents minimal activity with at least one bar.
When an end device (node) is logged into a port, moving the mouse pointer over the port’s bar
graph in the Performance View highlights the graph and displays a message with the WWN of the
connected node.