GW Instek GSP-930 User Manual User Manual
Page 103
BASIC OPERATION
101
Example:
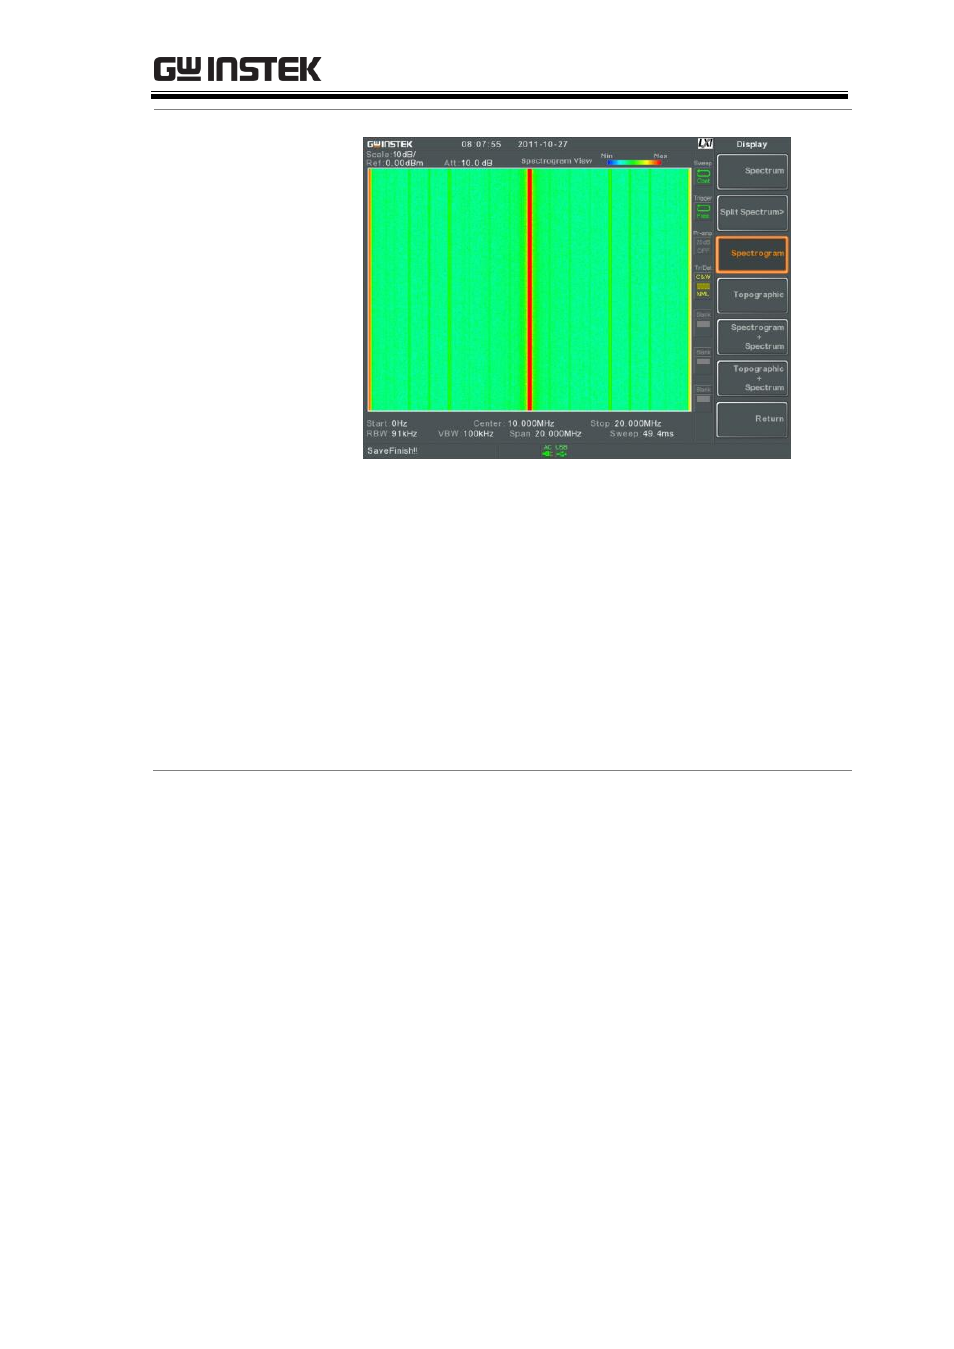
Spectrogram
The Spectrogram view shows signals in both
the frequency and time domain. The X-axis
represents frequency, the Y-axis represents time
and the color of each point represents the
amplitude at a particular frequency & time
(Red = high dark blue = low).
Each new trace is shown at the bottom of the
display and older traces are pushed up toward
the top of the display until they are removed.
See also other documents in the category GW Instek Equipment:
- GDB-03 (99 pages)
- GLA-1000 Series User Manual (111 pages)
- GLA-1000 Series Quick start guide (20 pages)
- GOS-630FC (20 pages)
- GOS-635G (36 pages)
- GOS-6000 Series (27 pages)
- GOS-6103C (30 pages)
- GOS-6100 Series (30 pages)
- GRS-6000A Series (51 pages)
- GDS-122 Installation Guide (4 pages)
- GDS-122 User Manual (52 pages)
- GDS-2000A series CAN/LIN bus User Manual (18 pages)
- GDS-2000A series Quick start guide for DS2-FGN (6 pages)
- GDS-2000A series Freewave User Manual (26 pages)
- GDS-2000A series Quick start guide for Logic analyzer option (18 pages)
- GDS-2000A series Quick start quide for DS2-LAN (2 pages)
- GDS-2000A series Option User Manual (80 pages)
- GDS-2000A series User Manual (261 pages)
- GDS-2000A series Programming Manual (272 pages)
- GDS-2000A series Single sheet for LA Quick start guide (2 pages)
- GBS-1000 Series Programming Manual (88 pages)
- GBS-1000 Series User Manual (187 pages)
- GDS-1000-U Series firmware upgrade (1 page)
- GDS-1000-U Series Programming Manual (70 pages)
- GDS-1000-U Series Quick start guide (2 pages)
- GDS-1000-U Series User Manual (133 pages)
- GDS-1000A-U Series Programming Manual (88 pages)
- GDS-1000A-U Series Quick start guide (2 pages)
- GDS-1000A-U Series User Manual (148 pages)
- GDS-3000 Series GCP-530/1030 current probe User Manual (40 pages)
- GDS-3000 Series GDP-025/050/100 differential probe User Manual (21 pages)
- GDS-3000 Series DS3-PWR Power analysis manual (37 pages)
- GDS-3000 Series User Manual (209 pages)
- GDS-3000 Series Programming Manual (103 pages)
- GDS-3000 Series DS3-SBD Serial Bus decode (29 pages)
- GDS-3000 Series GKT-100 deskew fixture User Manual (1 page)
- GDS-3000 Series GUG-001, GPIB to USB adapter User Manual (15 pages)
- GDS-300 Series User Manual (188 pages)
- GDS-300 Series Programming Manual (139 pages)
- GDS-300 Series Quick start guide (21 pages)
- GRF-3300 Series Student Manual (26 pages)
- GRF-3300 Series Teacher Manual (26 pages)
- GRF-1300A (124 pages)
- GSP-810 User Manual (40 pages)
- GSP-810 Software Manual (3 pages)