5 setting the waveform time axis, 5 setting the waveform time axis -10 – Yokogawa DAQWORX User Manual
Page 146
6-10
IM WX102-01E
6.5
Setting the Waveform Time Axis
Displaying the complete waveform
Select TimeAxis > All, to display to display the complete waveform on the TimeAxis.
Time Axis Zoom
Historical Viewer allows two ways to zoom waveforms in X-Axis direction:
• Easily enlarge / reduce a waveform using the Auto Zoom function.
• Exact Zoom using the TimeAxis > Set Scale... function.
• Auto Zoom
To enlarge waveforms in TimeAxis direction, select TimeAxis > Zoom In, or click the
Zoom In button on the toolbar (see below).
To reduce a waveform in TimeAxis direction, select TimeAxis > Zoom Out, or click the
Zoom Out button on the toolbar (below).
Zoom in
Zoom out
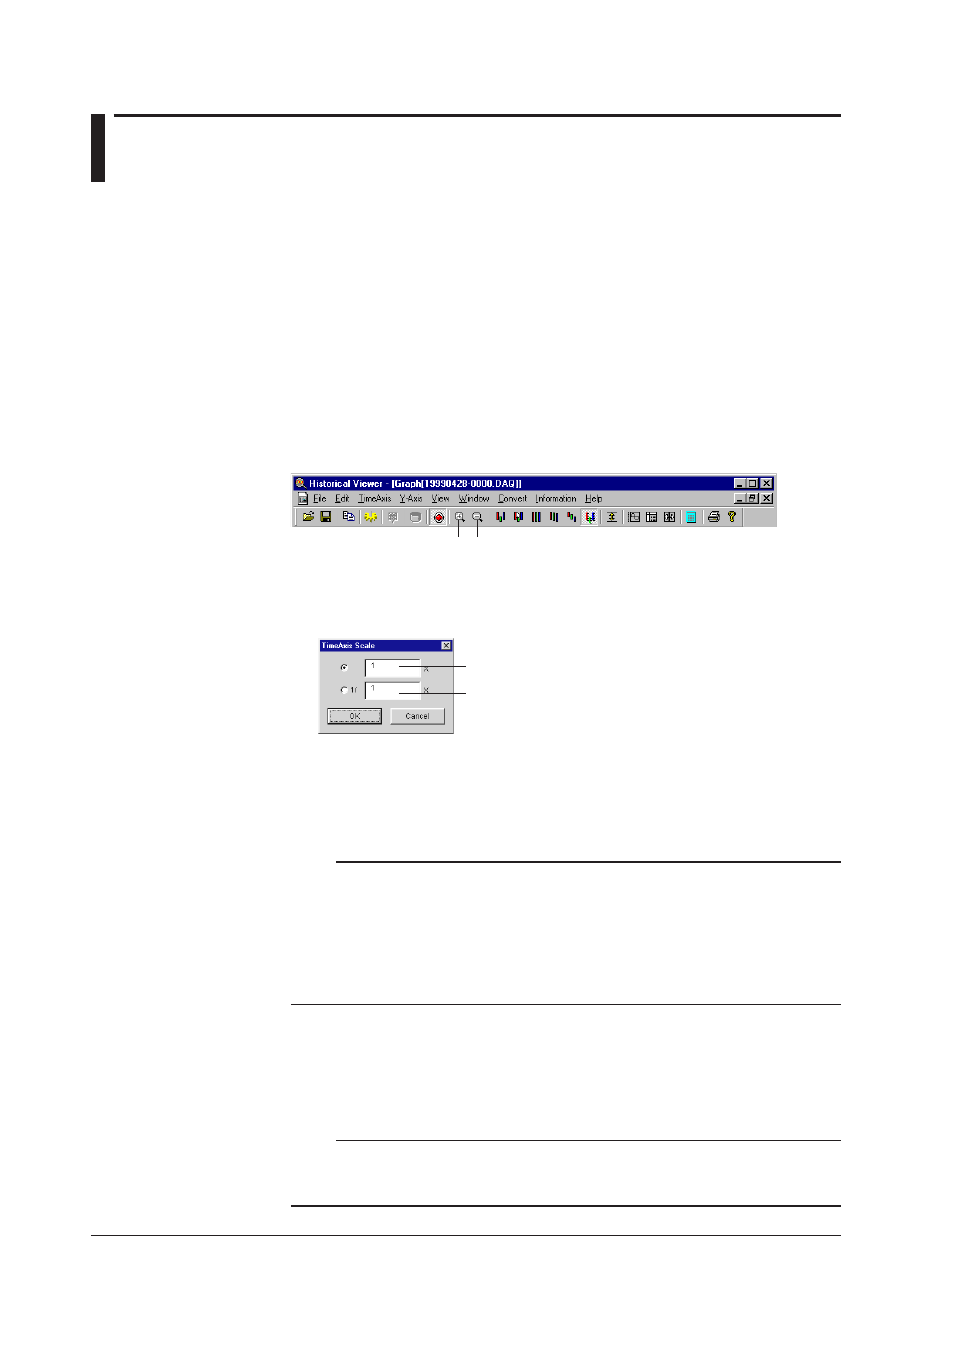
• Exact Zoom
If you wish to set the zoom factor more precise, do as follows:
1
Select TimeAxis > Set Scale.
Zoom in
Zoom out
2
To enlarge a waveform, enter the magnification factor in the upper box. To reduce
a waveform, enter the reduction factor in the lower box.
3
Click OK.
The waveform appears enlarged/reduced in the TimeAxis direction.
Note
• Set an integer between 1 and 20 as magnification factor .
Magnification factor 5 means that 5 data items per vertical monitor line are displayed.
Set the reduction factor between 1/1 and 1/1000.
Reduction factor 1/500 means that 1 data item per 500 vertical monitor lines is displayed.
• If a cursor is set, it will be the center of the zoom action if the first data is not displayed.
• If cursor A and B are set, the middlepoint of the two cursors become the center of the zoom
action if the first measurement data is not displayed.
Changing the scale display of the TimeAxis
To change the Time Axis of the waveform display, select TimeAxis > and Absolute Time,
or Relative Time from the Trend monitor menubar.
• Absolute time shows the actual time during display.
• Relative time shows the time lag from the first displayed data.
Note
• The time axis scale will change automatically, depending on the display time range.
• When data were collected with an external sampling clock, the data number scale will get
displayed on the Time Axis. Time will get displayed in the digital value sheet.