4 displaying waveforms on the monitor, 4 displaying waveforms on the monitor -8 – Yokogawa DAQWORX User Manual
Page 118
5-8
IM WX102-01E
5.4
Displaying Waveforms on the Monitor
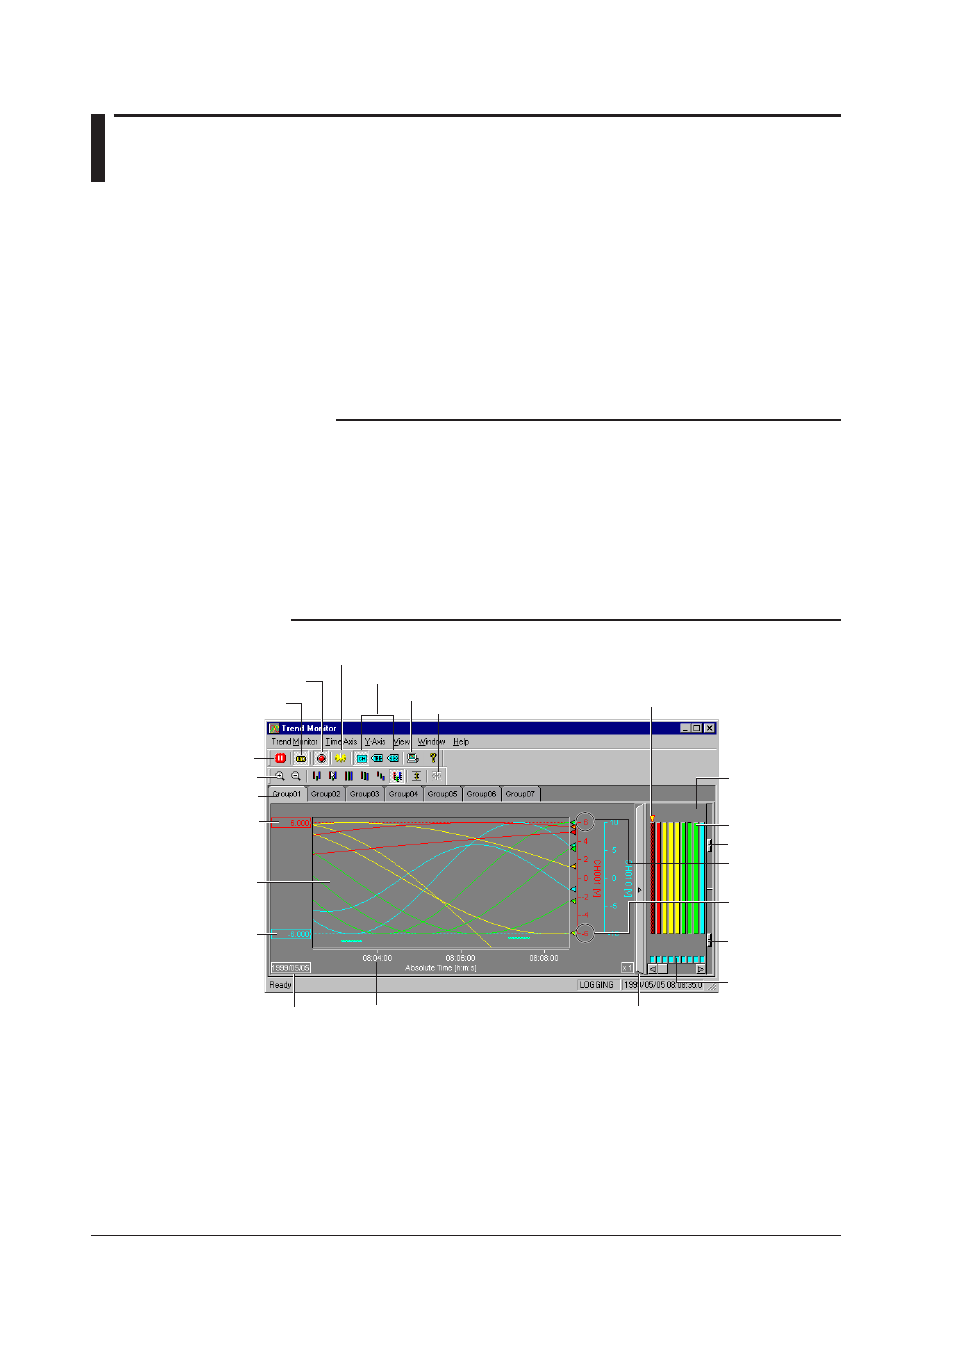
Logger software allows you to display measurement data on a Trend Monitor, Color
Monitor, Numeric Monitor, Meter Monitor, and Alarm Monitor.
1
To open monitors, push the Trend, Color, Numeric, Meter, or Alarm icon in
the Logger toolbox or select Logging > ,and the appropriate monitor from the
menubar.
2
To start actual monitoring, click the Monitor icon in the Logger toolbox or select
Logging > Monitor. Measurement values will start to get displayed on all display
monitors.
Note
• Select how to display more than one display monitor on your screen by selecting Window >
and Cascade, or Tile, from the Logger menubar.
• If the whole screen is filled with monitors, hiding the Logger Toolbar, you can let it appear
again by clicking the Logger icon above each monitor screen, or by selecting Window >
Logger from the monitors menubar.
• Without starting monitoring, no measurement values will get displayed even when you open
the monitor screens.
• If monitoring is started, but no monitors are opened, data acquiring commences. The data
will all be displayed, as soon as you open a monitor.
• It is possible to open several monitors at the same time, but it may slow down performance.
Cursor value display
Alarm ON/OFF
Switch tags
Logger
General display settings
Monitor links
Group tabs
Pause button
Time axis zoom
Waveform
display area
Trip line 1 (red)
current waveform
Maximum value
current waveform
Trip line 2 (blue)
current waveform
Minimum value
current waveform
Time (Period)
Display zone
Grid brilliance
Background
brilliance
Waveform
display ON/OFF
Displaying/hiding Zone display area
Zone display
area
Indicator currently
displayed zone
Date