Chromatogram view – Bio-Rad ChromLab™ Software User Manual
Page 37
Chromatogram View
User Guide
| 35
Chromatogram View
A chromatogram shows the real-time acquisition of data during the run as well as its
outcome. It also depicts the quality of the purification. The chromatogram is
recorded only when pumps are running and data are being acquired by the
detectors in the fluidic scheme.
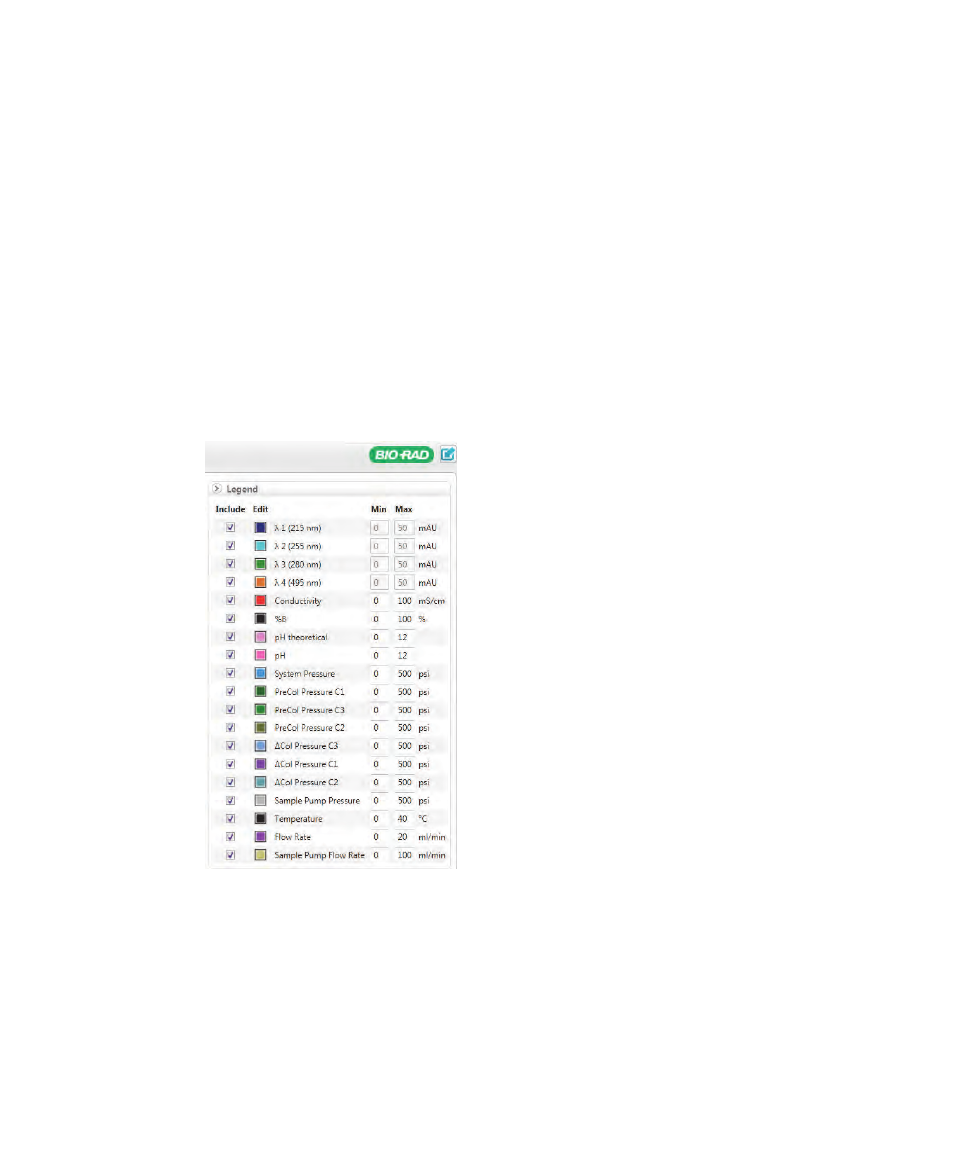
The chromatogram legend matches each colored trace to its detector type. When
you expand the legend, you can hide traces by clearing the checkbox beside the
trace, edit trace colors to differentiate among them, and change the y-axis scale for
for more information.
When a run starts, the chromatogram viewer in the System Control window displays
data acquired from the detectors as traces based on time, volume, or column
volume. Pausing the pointer on a trace displays a tooltip with the trace x- and
primary (left) y-axis values at that location. The legend also displays the wavelength
value in nanometers for UV traces.